
Why Solar Inspection Needs Automation
The solar industry added a record 452 GW of new capacity in 2024 alone, a 32.2% increase over the previous year (IRENA, 2025). This growth creates a maintenance problem that scales faster than the workforce can follow. According to Raptor Maps' 2025 Global Solar Report, equipment-driven underperformance increased 214% over five years, translating to $10 billion in unrealized revenue across the global fleet in 2024.
Manual inspection of solar panels is slow, expensive, and error-prone. A trained technician walking rows of panels with a handheld thermal camera can cover roughly 1-2 MW per day. At that rate, a 100 MW utility-scale farm takes months to inspect, and by the time the crew finishes, conditions at the first panels have already changed. Defects that are invisible to the naked eye, like internal cell cracks or early-stage Potential Induced Degradation (PID), go undetected entirely without specialized imaging equipment.
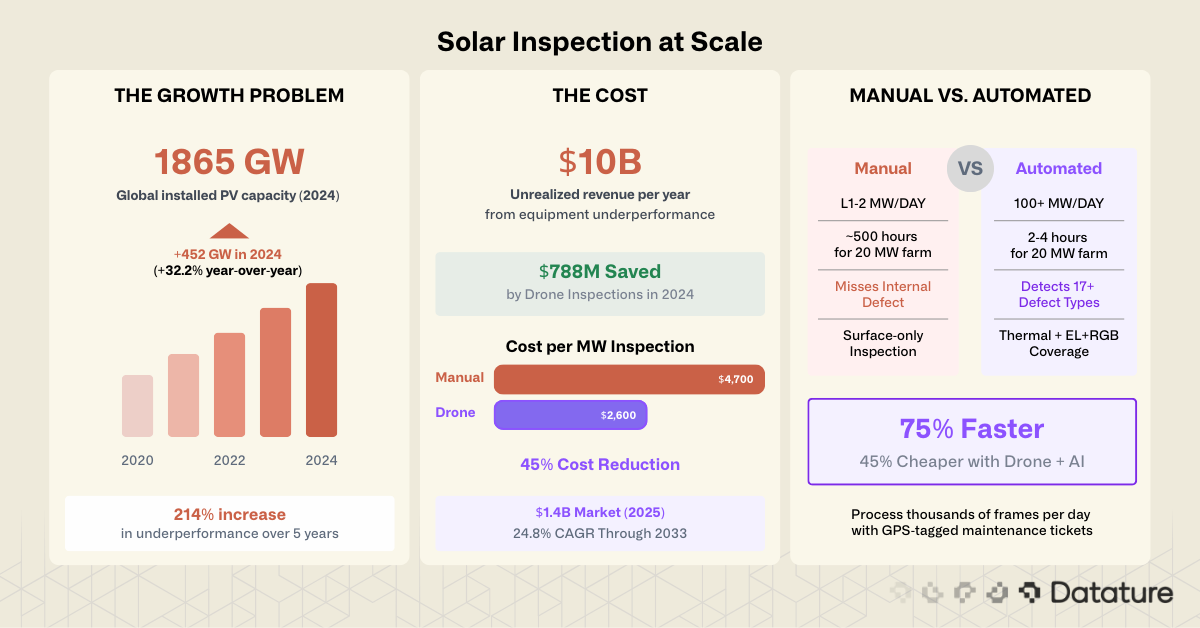
Drone-based inspection with computer vision has changed this equation. A drone equipped with a thermal and RGB camera can cover 100+ MW per day at a cost roughly 45% lower than manual methods. The captured imagery feeds into ML models that classify defects per-panel, generate GPS-tagged maintenance tickets, and prioritize repairs by severity. The result: faster inspections, fewer missed defects, and maintenance budgets that go where they matter most.
Solar Panel Defect Taxonomy
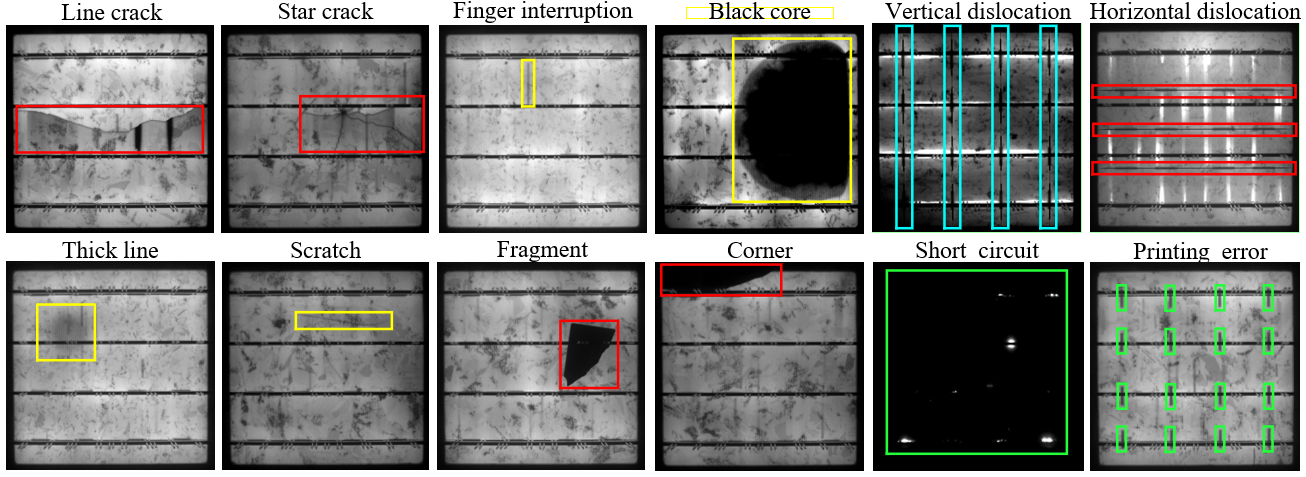
PV modules experience 17+ documented failure types across their 25-30 year operational lifetime. Each defect has a different root cause, a different visual signature, and a different impact on power output. Understanding this taxonomy is the first step in designing a detection system, because the defect type determines which imaging modality you need and which ML architecture works best.
Structural and Electrical Defects
Cell cracks (micro-cracks) are hairline fractures in the silicon cells caused by mechanical stress during transport, installation, or thermal cycling. They are often invisible to the naked eye and to RGB cameras, but show clearly in electroluminescence (EL) images as dark lines across cell boundaries. Untreated cracks expand over time and create hotspots that accelerate degradation.
Hotspots are localized areas of extreme overheating caused by cell mismatch, cracked cells, shading, or reverse-bias conditions. Surface temperatures can exceed 150C, creating a fire hazard. Hotspots are the primary target of thermal IR inspection because they show as bright anomalies against the uniform temperature of healthy panels.
Potential Induced Degradation (PID) results from ion migration caused by high voltage potential between the module frame and its cells. PID can cause up to 30% power loss across entire strings, making it one of the most damaging systemic failure modes. In EL images, PID-affected cells appear dark or dim compared to healthy neighbors.
Diode failure occurs when bypass diodes in the junction box malfunction, causing entire sub-strings to stop conducting. Thermal imaging reveals diode failures as characteristic heat patterns across one-third of a module (the sub-string protected by the failed diode).
Surface and Environmental Defects
Soiling and sand accumulation reduces light transmittance across the panel surface. In desert installations, sand buildup is the dominant cause of performance loss, reducing output by 1-5% per month without cleaning. RGB cameras detect soiling directly, while thermal cameras reveal the uneven heating pattern caused by partial shading from dirt.
Bird droppings create localized shading that causes hotspots and potential corrosion of the anti-reflective coating. While individually minor, bird droppings are a persistent issue on large solar farms and compound into significant losses across thousands of panels.
Snail trails are brownish discoloration patterns along cell grid lines caused by moisture penetrating through micro-cracks. Moisture and acetic acid (from EVA degradation) penetrate through the micro-cracks, dissolving silver ions from the grid fingers. These ions migrate into the EVA encapsulant and are reduced to metallic silver nanoparticles that produce the characteristic brownish discoloration. Snail trails are visible in RGB images, but they indicate underlying micro-cracks that only EL imaging can fully map.
Delamination is the separation of the encapsulant (EVA) from the glass or backsheet, allowing moisture ingress and accelerating internal degradation. UV fluorescence imaging is the most effective method for detecting delamination and EVA degradation.
Broken glass from hail, rocks, or tools is visible in RGB imagery and represents both a structural and electrical risk.
.png)
Defect Severity and Detection Priority
Not all defects carry equal weight. A prioritized inspection system should flag safety-critical defects (hotspots above 30C differential, broken glass, diode failures) for immediate attention, schedule high-impact defects (PID, cell cracks, delamination) for near-term repair, and log low-severity defects (mild soiling, bird droppings) for routine cleaning cycles. This tiered approach is where ML classification adds the most value: a trained model can automatically sort thousands of detected anomalies into priority queues, replacing the judgment calls that slow down manual inspection reports.
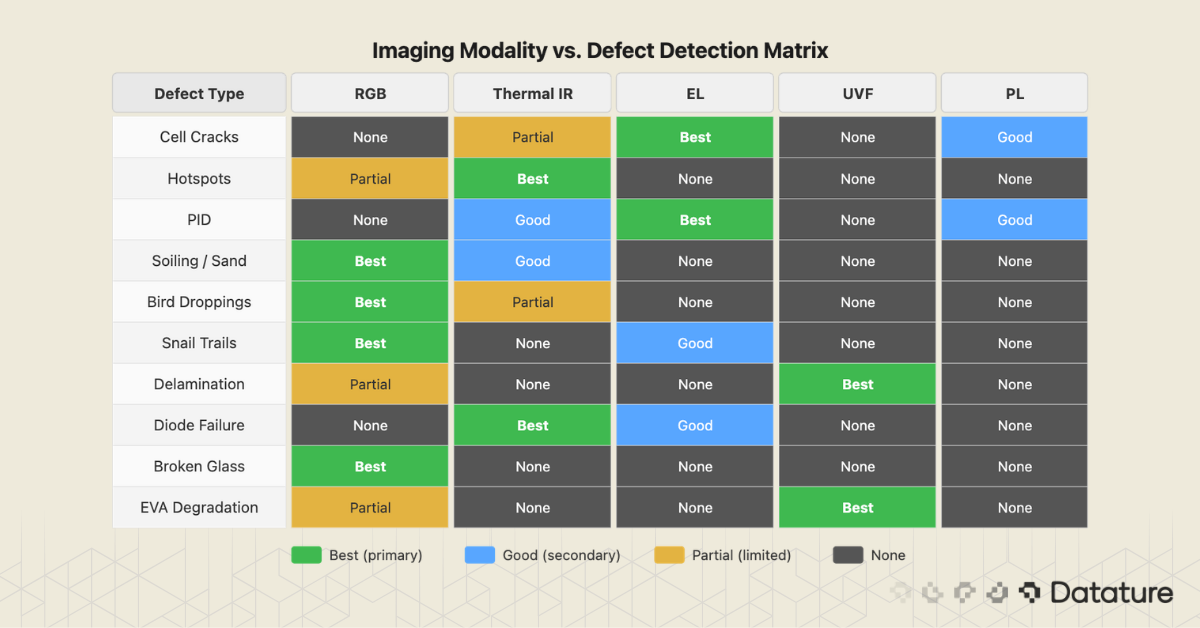
Multi-Spectrum Imaging: How Different Light Reveals Different Defects
No single imaging modality captures all defect types. Solar inspection relies on multiple spectrums, each tuned to a different physical phenomenon. The choice of imaging equipment determines what your ML model can detect, so understanding these modalities is as important as choosing the right neural network architecture.
RGB (Visible Light)
Standard cameras capture surface-level defects: soiling, bird droppings, broken glass, snail trails, vegetation encroachment, and visible discoloration. RGB inspection is cheap and fast, with drone-mounted cameras achieving sub-centimeter ground sampling distance (GSD) at typical flight altitudes. The limitation is that RGB cannot detect internal electrical defects. A panel with severe PID or micro-cracks may look perfectly normal in visible light.
Thermal Infrared (IR)
Radiometric thermal cameras (typically 640x512 pixel resolution or higher, sensitivity below 50 mK) capture heat patterns that reveal hotspots, PID effects, diode failures, connection faults, and string-level underperformance. Thermal IR is the workhorse of drone-based solar inspection because it operates in real time on panels under natural sunlight, covers large areas quickly, and detects the most operationally significant defect categories. The IEC 62446-3 standard defines protocols for thermal IR inspection of PV systems. Common hardware includes the DJI Zenmuse H30T (1280x1024 thermal sensor) and FLIR Vue Pro R.
Environmental Requirements for Thermal Inspection
Reliable thermal inspection requires specific conditions per IEC 62446-3: minimum irradiance of 600 W/m2, stable cloud-free skies, low wind speed (below 5 m/s), and operation during peak solar hours. Temperature anomaly thresholds (such as the 30C differential for safety-critical hotspots) are irradiance-dependent, so inspections under low-irradiance conditions produce unreliable results.
Electroluminescence (EL)
EL imaging is the gold standard for detecting internal cell defects. A near-infrared sensitive camera (900-1200nm) captures light emitted when current is injected into the module in forward bias. Cracks, finger interruptions, PID shunting, and inactive cell areas all appear as dark regions in the luminescence map. EL achieves sub-cell resolution that no other field method can match. CNN-based classification models trained on EL images consistently achieve 95%+ precision for PID detection and multi-class defect classification, with the best systems reaching over 96% on curated datasets (IEEE, ScienceDirect, 2024). The trade-off is that traditional EL requires darkness and electrical access to each module, limiting it to nighttime or indoor testing.
UV Fluorescence (UVF)
UV fluorescence imaging uses a 365nm UV light source to excite fluorescence in the EVA encapsulant. Different levels of photochemical degradation produce different fluorescence intensities, making UVF uniquely effective at detecting delamination, yellowing, and aging patterns invisible to other methods. UVF can also identify cell cracks in chronological order of occurrence, based on how the crack has affected encapsulant degradation over time. Like EL, UVF requires darkness for field use.
Photoluminescence (PL)
PL imaging uses an external light source (laser or LED) to excite photoluminescence in the cells, with a camera capturing the emission. PL reveals similar defect categories to EL (cracks, shunts, material quality) but without requiring electrical contact. This makes PL useful in manufacturing quality control and for testing individual cells or pre-lamination wafers. Field use is limited by the need for controlled lighting conditions.
Drone-Based Solar Inspection Workflows
Drones have become the dominant inspection method for utility-scale solar farms, replacing manual walkthroughs for both thermal and RGB data capture. The economics are clear: a drone inspection costs roughly $2,100 less per MW than manual inspection, runs 75% faster, and captures data that can be reprocessed as detection models improve.
Hardware and Flight Operations
The standard setup for solar inspection is a commercial drone carrying both a thermal and RGB camera. The DJI Matrice 400 RTK with the Zenmuse H30T payload is currently the most common platform, offering simultaneous thermal (1280x1024, <50 mK) and visual (48 MP) capture with RTK positioning for centimeter-level GPS accuracy. For smaller commercial and industrial (C&I) installations, the DJI Mavic 3T provides a lighter option with an integrated thermal sensor.
Commercial drone operations require appropriate certifications (FAA Part 107 in the US, EU drone regulations in Europe) and operators should verify local airspace restrictions and privacy requirements, especially for rooftop installations near residential areas.
Automated flight missions follow grid patterns at 15-30m altitude, capturing images at intervals that ensure 70-80% overlap for orthomosaic stitching. A 1 MW site takes approximately 8 minutes to fly. A 20 MW farm completes in 2-4 hours. Operators with multiple drones can cover 100+ MW in a single day.
From Raw Imagery to Actionable Reports
The drone captures thousands of individual frames. The post-processing pipeline has four stages:
- Orthomosaic generation: Individual thermal and RGB frames are stitched into georeferenced maps of the entire site using photogrammetry software (Pix4D, DroneDeploy, or Agisoft Metashape).
- Panel detection and segmentation: An ML model identifies individual panels and their boundaries in the orthomosaic. This is typically a segmentation task, using architectures like U-Net or Mask R-CNN.
- Anomaly detection and classification: A second model (or a multi-task model) classifies each panel for defect types and severity. YOLO variants are dominant here for their speed and accuracy balance.
- Report generation: Detected anomalies are exported as GPS-tagged maintenance tickets with defect class, severity, and location, ready for the O&M team to act on.
.png)
Industry Scale and ROI
The drone-based solar inspection market reached $1.4 billion in North America in 2025 and is growing at a 24.8% CAGR through 2033 (HTF Market Insights). Raptor Maps reports that drone inspections saved $788 million across PV systems in 2024, up from $435 million in 2020. A systematic review of AI-driven predictive maintenance for PV systems (Energy Informatics, 2025; DOI: 10.1186/s42162-025-00594-6) found that ML integration consistently reduces unplanned downtime and operational costs, with multiple case studies reporting 25-40% efficiency improvements and significant failure prevention rates. The World Economic Forum reports that AI-driven maintenance systems deliver 25% productivity gains and 70% fewer breakdowns across the solar sector.
Satellite Imagery for Portfolio-Wide Monitoring
Satellite imagery provides a macro-level complement to drone inspections, covering the use cases where site-by-site drone flights are impractical or too expensive.
Portfolio-wide monitoring is the primary application. Operators managing hundreds of distributed rooftop or C&I installations cannot send drones to every site on a regular schedule. Satellite imagery (0.3-3m per pixel from commercial providers) enables tracking of performance indicators across the entire portfolio: vegetation encroachment, soiling buildup, panel row integrity, and construction progress.
Degradation trending over months and years uses multi-temporal satellite images to detect gradual changes, like progressive soiling in dusty climates or shading from growing trees, that single-point inspections miss.
Pre-inspection triage is where satellite and drone workflows connect. Satellite analysis identifies underperforming sections of a large plant, and targeted drone flights focus on those areas rather than surveying the entire site. This reduces drone flight time and prioritizes inspection resources.
The limitation is spatial resolution. At 0.3-3m per pixel, satellite imagery cannot resolve individual panel-level defects. It is a site-level monitoring tool, not a replacement for drone or ground-based inspection.
ML Models for Solar Defect Detection
The choice of ML architecture depends on the task: Are you detecting defects (bounding boxes), segmenting defect boundaries (pixel masks), or classifying panel condition (healthy vs. defective)? Each task maps to a different model family.
Object Detection with YOLO
The YOLO family dominates real-time defect detection in solar inspection. YOLO models locate defects with bounding boxes and classify them in a single forward pass, making them fast enough for processing thousands of drone frames per site.
.png)
For teams building detection models from scratch, starting with a pretrained YOLO backbone and fine-tuning on solar-specific data is the most efficient path. With 500-1,000 labeled thermal or EL images, fine-tuned YOLO models consistently reach 85-95% mAP on focused defect categories. YOLO26, released in January 2026, is the latest generation and introduces improvements to small-object detection that are directly relevant to thermal anomaly identification; benchmarks on solar-specific datasets are expected in the coming months. For background on how the YOLO architecture has evolved, see our historical breakdown of YOLO.
Semantic Segmentation with U-Net
Where bounding boxes mark "there is a defect here," segmentation masks outline the exact boundary of the defect at pixel level. This matters for cracks (which follow irregular paths across cells), hotspot boundary mapping, and soiling coverage estimation.
U-Net and its variants are the primary architecture for solar defect segmentation. Modified U-Nets with batch normalization and optimized loss functions achieve strong accuracy on irregular defect boundaries in both thermal and EL images. Mask R-CNN offers an alternative for instance segmentation, where you need to distinguish between overlapping defects on the same panel.
Recent YOLO versions (YOLOv8-seg and later) include segmentation heads that combine detection and mask prediction in a single model, which is useful when you need both bounding boxes for reporting and masks for precise defect measurement.
Vision Transformers and Hybrid Architectures
Transformer-based detectors are gaining ground. A 2024 benchmark study found that Swin Transformer achieved the highest overall detection performance on solar defect datasets: 0.88 precision, 0.85 recall, and 0.87 mAP, outperforming all CNN-based detectors tested (Nature Scientific Reports, 2024). Vision Transformers excel at capturing long-range dependencies in images, which helps with defects that span multiple cells or follow grid-line patterns.
EfficientNet variants, especially EfficientNetB3, perform well for classification tasks (healthy vs. defective, or multi-class defect type classification), reaching 97.44% accuracy with transfer learning. HybridSolarNet (EfficientNet + CBAM attention, 2026) pushes this further with real-time fault detection optimized for edge deployment on drones.
Small Object Detection
Many solar defects are small: early-stage hotspots span only a few pixels in wide-area thermal captures, and individual cell cracks in EL images are thin lines that standard detectors miss. SAHI (Slicing Aided Hyper Inference) is a practical technique for improving small-object detection by running inference on overlapping image tiles and merging the results. Combining SAHI with YOLO variants has shown significant improvements in detecting small thermal anomalies in drone-captured solar imagery.
.png)
Public Datasets for Solar Defect Detection
Several open datasets provide a starting point for training and benchmarking solar defect detection models.
.png)
For teams starting out, the PVEL-AD dataset (36,543 EL images with 12 defect classes and bounding box annotations) offers the most complete training corpus. The ELPV dataset is smaller but well-suited for classification experiments. The InfraredSolarModules dataset from Raptor Maps provides real-world thermal drone imagery, which is harder to find in public datasets.
Data augmentation is important when working with these datasets, especially for underrepresented defect classes. The ELPV dataset, for example, contains 1,502 functional images but only 123 moderate-defect images, a class imbalance that needs to be addressed through augmentation or sampling strategies before training.
Building Your Solar Defect Detector on Datature
This section walks through how to build a solar panel defect detection model using Datature Nexus, from uploading your dataset to deploying a trained model.
Step 1: Upload Your Solar Panel Dataset
Start by creating a new project in Datature Nexus and uploading your solar panel images. The platform accepts thermal IR images (TIFF, PNG, or JPEG from radiometric cameras), EL images (grayscale or near-IR captures), and standard RGB drone captures. You can upload directly from your local machine or connect cloud storage (Amazon S3 or Azure Blob) for larger datasets.
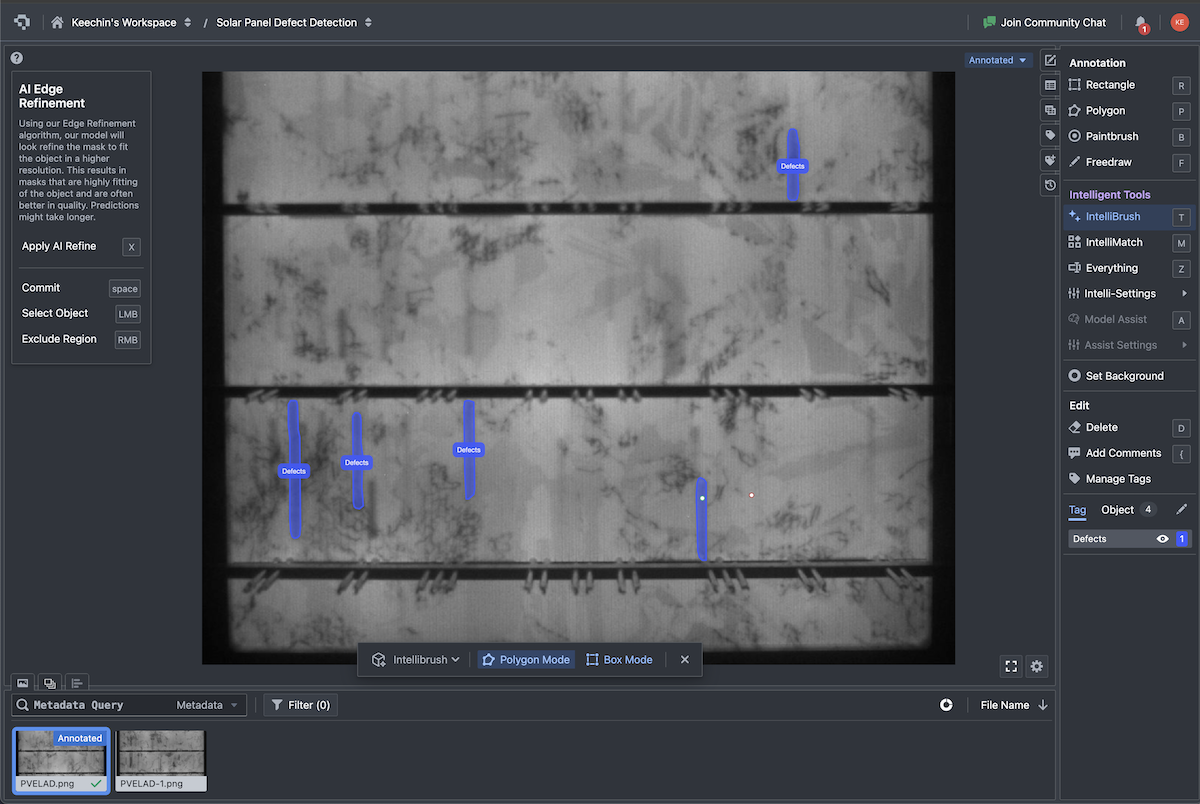
Step 2: Annotate Defects
Use Datature's annotation tools to label defects in your images. For object detection (hotspot detection, PID identification), draw bounding boxes around each defect and assign a class label. For segmentation tasks (crack boundary mapping, soiling coverage), use the polygon or brush tools to create pixel-level masks. SAM 2.0 integration can accelerate annotation of irregular shapes like cracks and snail trails, where manual polygon drawing is slow.
Set up your label ontology to match the defect categories you care about. A typical thermal inspection ontology might include: hotspot, PID, diode_failure, soiling, string_anomaly. An EL inspection ontology would cover: crack_line, crack_star, finger_interruption, black_core, PID_cell.
Annotation Tip
Thermal image annotation benefits from PV engineering expertise. Unlike RGB annotation where defects are visually obvious, thermal anomaly classification requires understanding of IEC 62446-3 categories, temperature differential thresholds, and the physical causes behind heat patterns. Pairing an ML engineer with a solar O&M specialist for the annotation phase produces higher-quality labels and better models.
Step 3: Configure and Train Your Model
Select your model architecture in the training workflow. For detection tasks, YOLO variants (YOLOv8, YOLO11) are the recommended starting point. For segmentation tasks, choose U-Net or Mask R-CNN. The platform handles hyperparameter configuration, but you can adjust learning rate, batch size, and augmentation settings based on your dataset size.
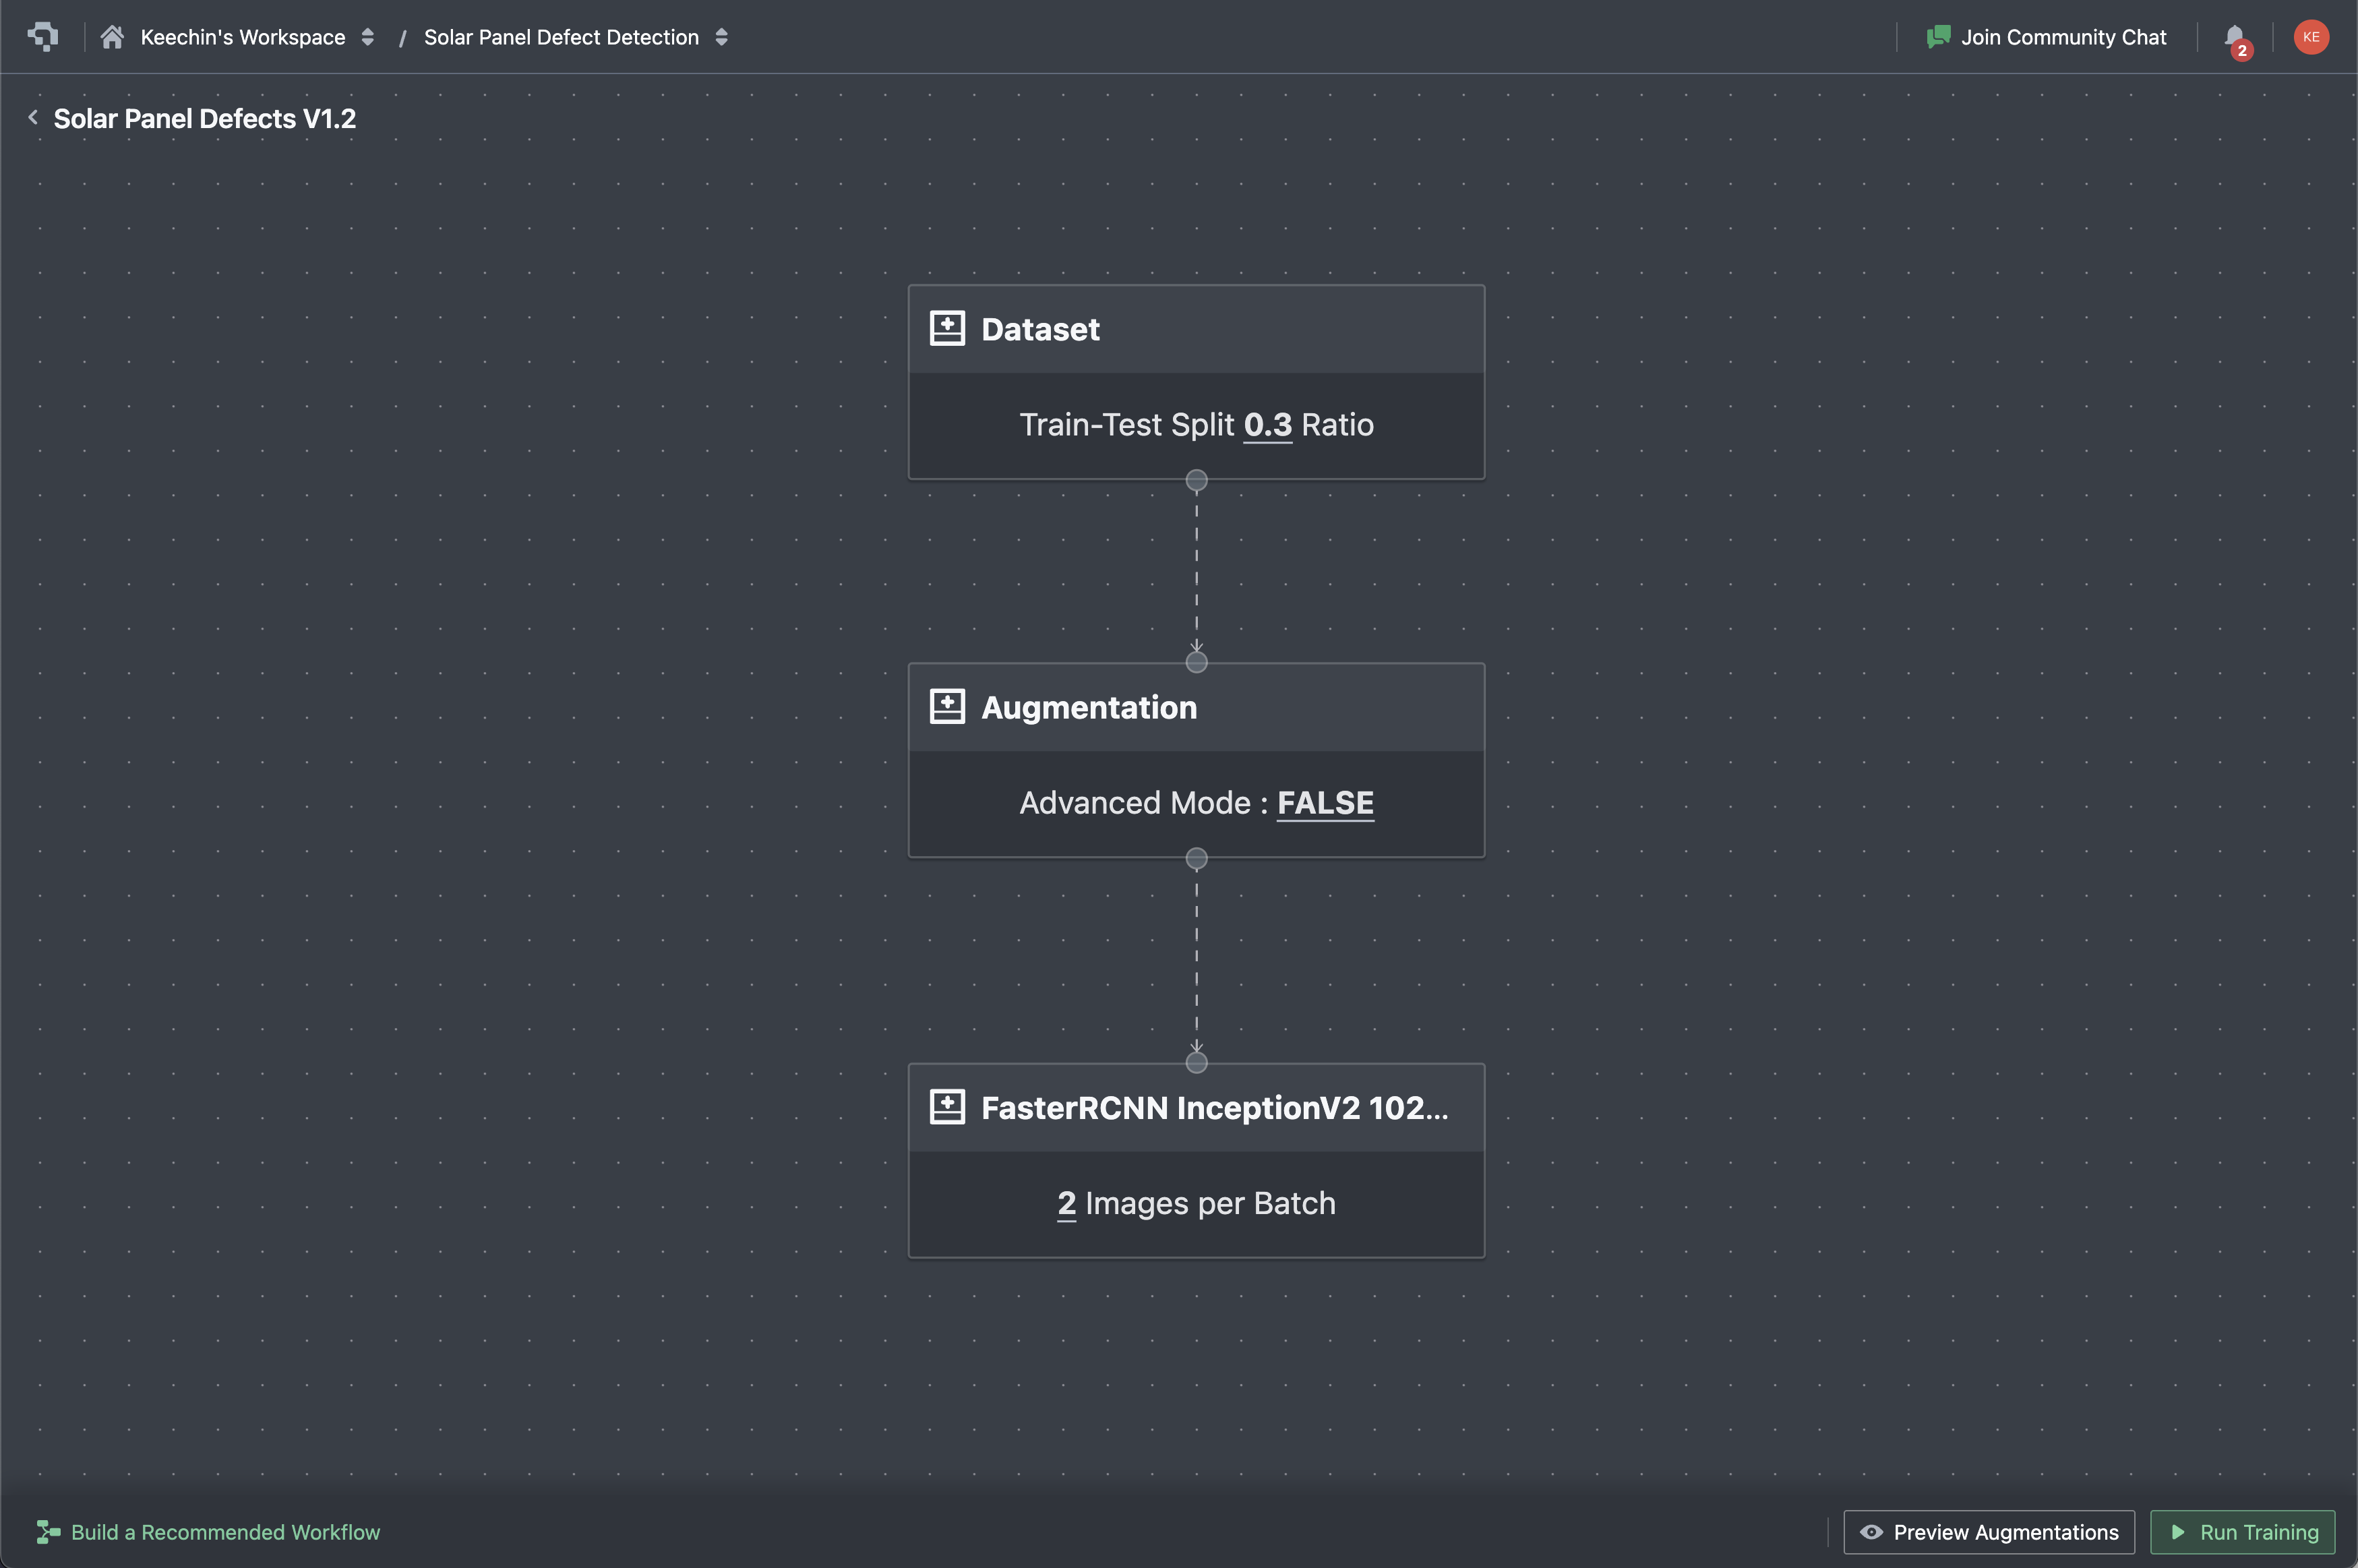
Training on a few hundred labeled images typically completes in 1-3 hours on Datature's cloud GPUs. The platform displays real-time training graphs showing loss curves, mAP progression, and per-class metrics so you can monitor convergence.
Step 4: Evaluate and Iterate
After training, evaluate your model's performance using Datature's built-in analysis tools. Review the confusion matrix to identify which defect classes the model confuses (e.g., mild hotspots vs. normal temperature variation). Run inference on held-out test images to check predictions visually.
If certain defect classes underperform, use active learning to identify the images where the model is least confident and prioritize those for additional annotation. This iterative cycle of label, train, evaluate, and refine is how inspection teams build models that improve with each round of field data.
Step 5: Deploy
Once your model meets accuracy targets, deploy it through Datature's API deployment for integration into your existing inspection software pipeline, or export it for edge deployment on drone-mounted compute modules or field tablets. Lightweight YOLO models exported as TFLite or ONNX run at real-time speeds on edge hardware like NVIDIA Jetson or Raspberry Pi.
VLMs for Automated Defect Reporting
Vision-Language Models (VLMs) are opening a new capability in solar inspection: automated defect reporting in natural language. Instead of outputting bounding boxes or class labels that require human interpretation, a VLM can look at a thermal image and generate a written inspection report describing what it sees, where the defects are, and what maintenance actions are recommended.
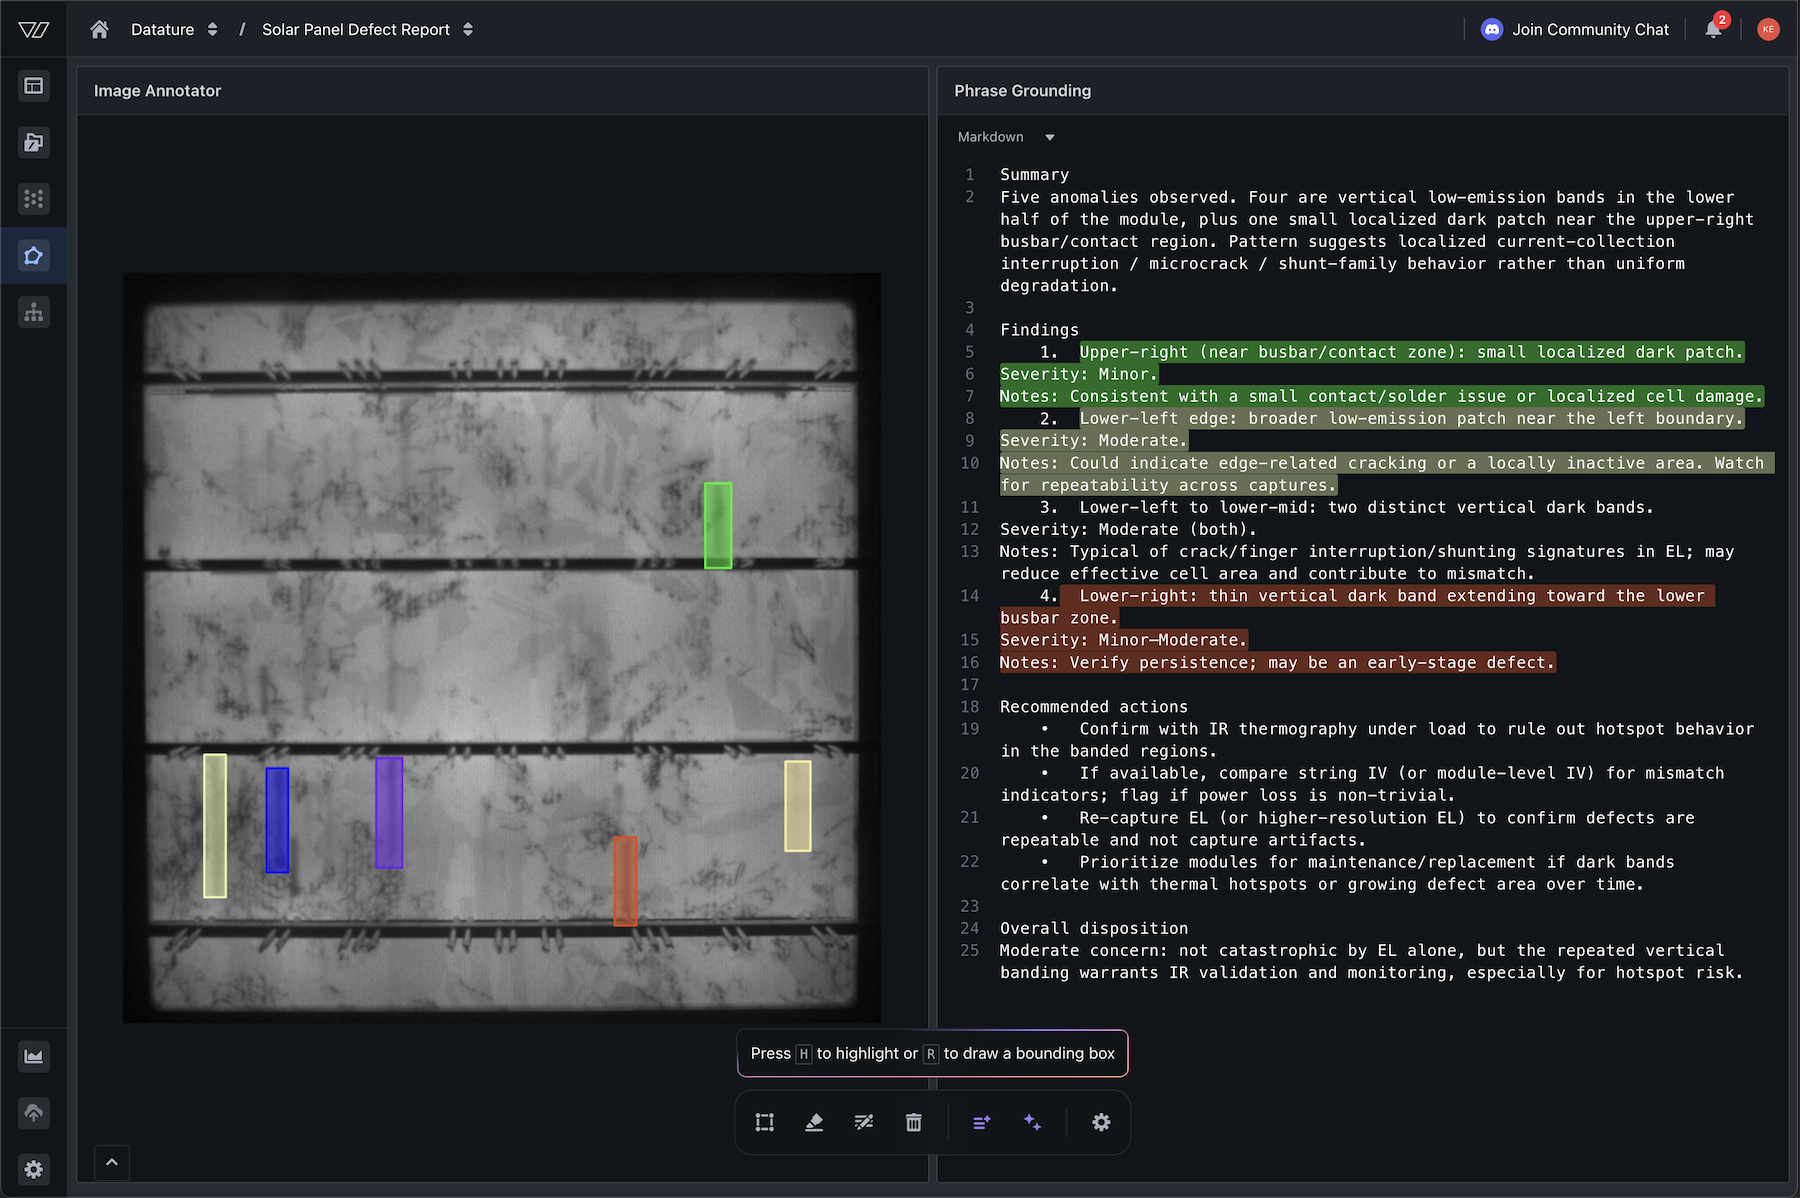
From Detection to Application Interface
Most solar panel inspection companies and software teams are bridging the detection to a customer-friendly interface that will allow their users to look at dashboards with some level of markups and descriptions. In this case, knowing the bounding box position alone is not enough. Teams increasingly need detection models to provide structured JSONs on where each defect is so that it can be efficiently rendered on the frontend and with VLMs, we are able to achieve the following outputs from the model with ample system prompting ↘
{
  "dataset": "SolarPanelDefect-Site-DH2978D",
  "asset": {
    "file_name": "DJI-Capture-EL.jpeg",
    "width": 1536,
    "height": 1523,
    "modality": "PV_EL"
  },
  "task": "vision_language_inspection_with_grounding",
  "defects": [
    {
      "id": "defect_1",
      "label": "defect",
      "visual_signature": "diffuse darkened region / low-luminance patch near the left edge",
      "likely_family": ["inactive_area", "shunt_or_cell_damage", "edge_crack"],
      "severity": "moderate",
      "confidence": 0.63,
      "bbox_xyxy_px": [39, 946, 115, 1325],
      "bbox_xyxy_norm": [0.025391, 0.621142, 0.074870, 0.869993],
      "location_hint": "lower-left (center ≈ x=5.0%, y=74.6%)"
    },
	.....
    {
      "id": "defect_5",
      "label": "defect",
      "visual_signature": "thin vertical dark stripe near the right side, extending toward the lower busbar zone",
      "likely_family": ["crack_or_microcrack", "finger_interruption", "localized_shunting"],
      "severity": "minor_to_moderate",
      "confidence": 0.61,
      "bbox_xyxy_px": [1026, 1156, 1055, 1385],
      "bbox_xyxy_norm": [0.667969, 0.759028, 0.686849, 0.909389],
      "location_hint": "lower-right (center ≈ x=67.7%, y=83.4%)"
    }
  ],
}
Practical Architecture: Detection + VLM Reporting
The most practical near-term architecture combines classical detection (YOLO for speed and precision) with VLM-based reporting (for interpretation and communication). The pipeline works like this:
- YOLO model processes drone imagery and outputs defect bounding boxes with class labels and confidence scores.
- Detected defect regions are cropped and passed to a VLM along with a structured prompt: "Describe this solar panel defect, its likely cause, severity, and recommended maintenance action."
- The VLM generates a natural-language report for each defect, which is appended to the GPS-tagged maintenance ticket.
This hybrid approach avoids the latency and cost of running a VLM on every image (impractical at 100+ MW scale), while adding interpretive value where it matters most: in the final report that drives maintenance decisions.
.png)
Emerging Trends in Solar Vision AI
Edge AI on Drones
Lightweight models like AE-YOLO (YOLOv11-based, 2025) and HybridSolarNet (EfficientNet + CBAM) are being optimized for on-device inference during flight. Rather than capturing imagery and processing it later, the drone detects defects in real time and can adjust its flight path to capture higher-resolution images of flagged panels. This reduces post-processing time and enables immediate alerts for safety-critical defects like fire-risk hotspots.
Digital Twins
Companies like Raptor Maps and Sitemark build georeferenced 3D digital twins of solar plants, where every panel has a unique identifier linked to its inspection history, performance data, and defect records. AI models run against the digital twin to predict which panels are likely to fail next, enabling true predictive maintenance rather than reactive repair.
Predictive Maintenance with Time-Series ML
Beyond visual inspection, time-series models (LSTM, temporal CNNs) analyze SCADA data, inverter logs, and weather records alongside inspection imagery to predict remaining useful life (RUL) of individual panels. Research shows RUL prediction accuracies of 73-82% up to two months in advance (Springer Energy Informatics, 2025). When combined with visual defect data from drone inspections, these models create a complete predictive maintenance system.
Daylight Electroluminescence
Traditional EL imaging requires darkness, limiting it to nighttime operations. Emerging research on daylight EL methods could eliminate this constraint, making high-resolution internal defect detection available during normal drone inspection flights alongside thermal and RGB capture. This is still experimental, but if validated at scale, it would add the most powerful defect detection modality to the standard daytime drone workflow.
Foundation Models for Solar
Pre-trained vision transformers (ViT, Swin) and self-supervised models (DINOv2) are being fine-tuned for solar defect tasks with significantly less labeled data than CNNs require. SAM (Segment Anything Model) has potential for zero-shot panel segmentation in drone imagery, automatically identifying panel boundaries without task-specific training. Grounding DINO combines text-grounded detection with SAM for open-vocabulary object detection, enabling defect identification using natural language prompts (e.g., "cracked solar cell," "hotspot on panel") without collecting task-specific labeled datasets.
Frequently Asked Questions
What is the best ML model for solar panel defect detection?
For most teams, a YOLO variant (YOLOv8 or YOLO11) fine-tuned on thermal or EL imagery is the best starting point. YOLO offers the strongest balance of accuracy and inference speed for processing large volumes of drone-captured images. PV-YOLOv12n achieved 0.91 mAP@50 on EL defect detection. For pixel-level defect mapping, pair YOLO detection with a U-Net segmentation model.
How many labeled images do I need to train a solar defect detector?
With transfer learning from a pretrained backbone, 500-1,000 well-labeled thermal or EL images typically achieve 85-95% mAP for focused defect detection tasks (e.g., hotspot detection, crack classification). Multi-class detection across 5+ defect types requires 2,000-5,000 images for stable generalization. Quality of annotations matters more than quantity.
Can computer vision detect all types of solar panel defects?
No. Different defects require different imaging modalities. Thermal IR detects hotspots, PID, and diode failures. Electroluminescence detects internal cracks, finger interruptions, and cell-level degradation. RGB detects surface defects like soiling, broken glass, and snail trails. UV fluorescence detects encapsulant degradation. A complete inspection program combines at least thermal IR and RGB, with EL imaging for high-value or warranty-critical modules.
.png)
.png)