


Introduction
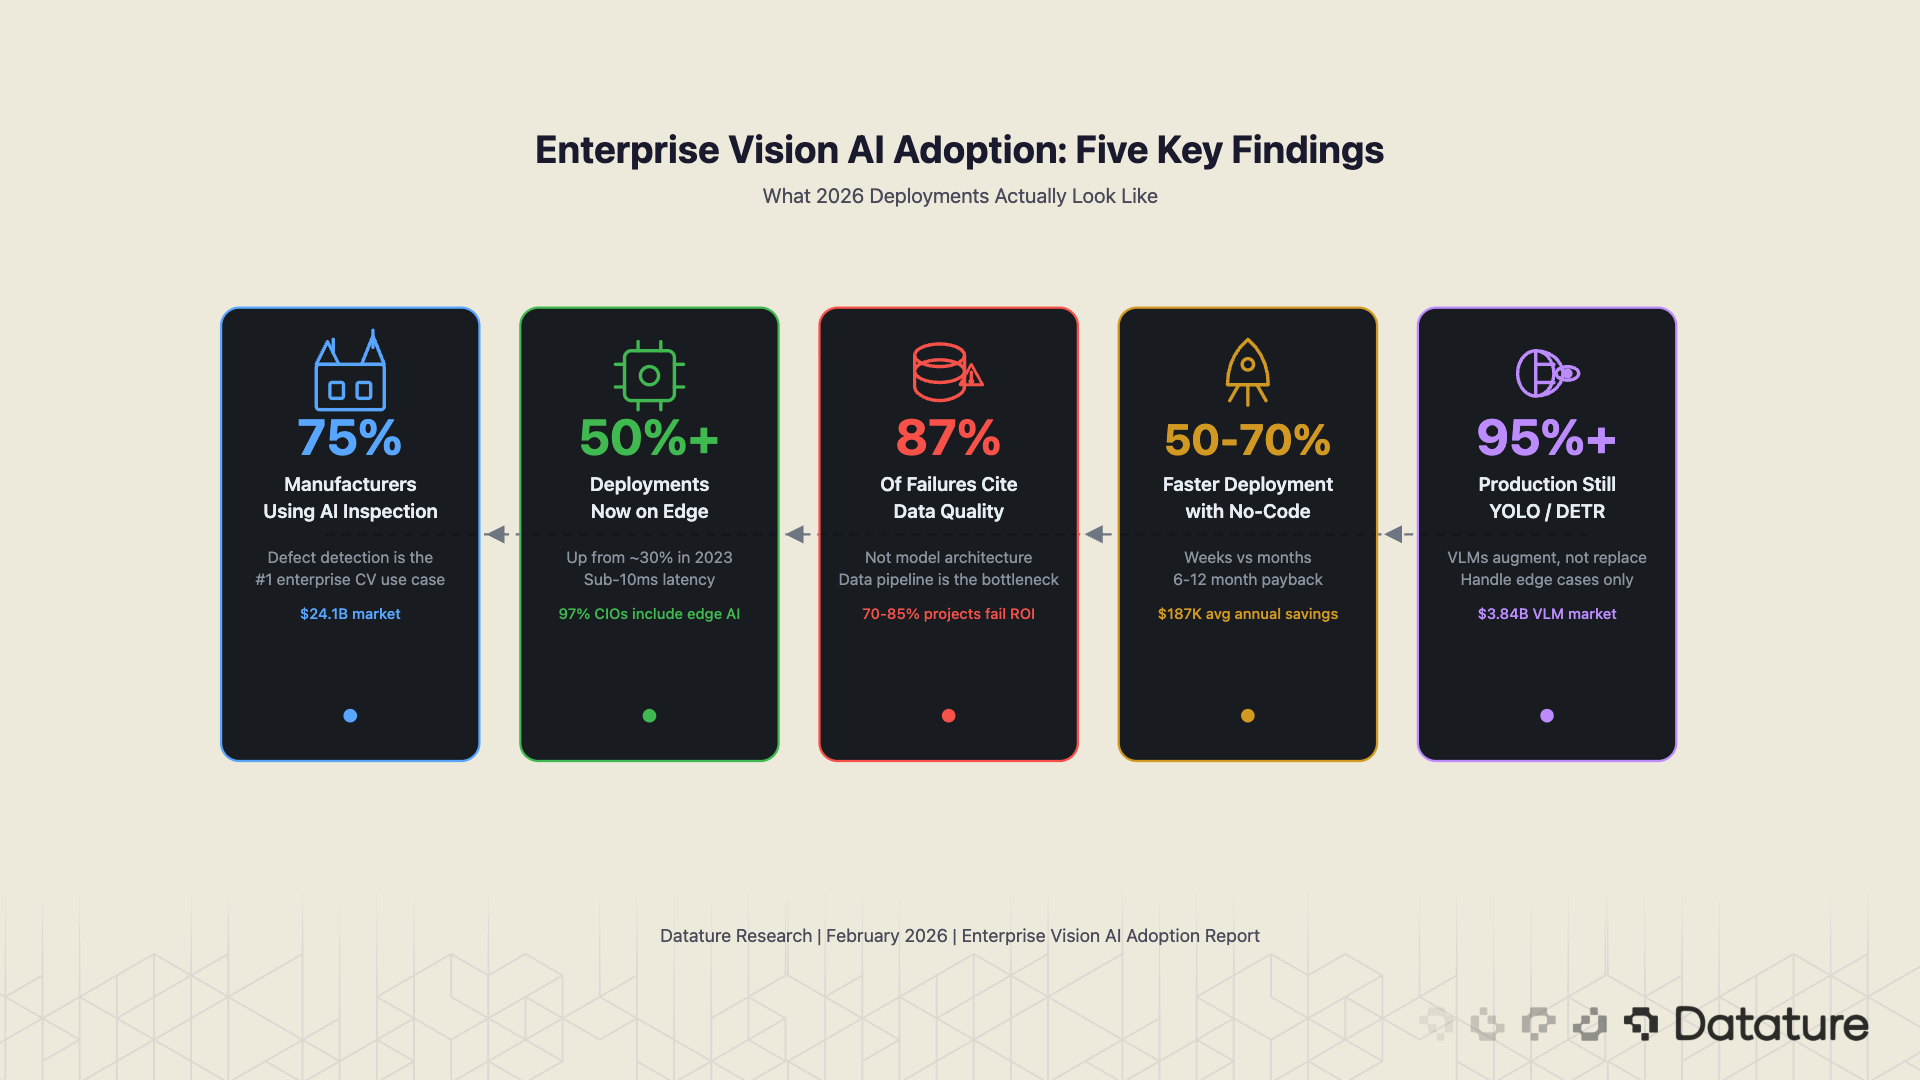
Enterprise computer vision adoption in 2026 is defined by a paradox: the technology has never been more accessible, yet most deployments still fail. The global CV market has crossed $20 billion, nearly 75% of manufacturers have adopted AI-powered inspection, and edge inference now accounts for over 50% of new model deployments. But 70-85% of enterprise AI projects still do not meet ROI expectations, and the primary cause is not model quality - it is data quality.
This report synthesizes market data from Fortune Business Insights, Grand View Research, and Mordor Intelligence alongside deployment patterns observed on the Datature Nexus platform to present a ground-truth picture of enterprise vision AI in 2026. The five takeaways that matter most ↘
Market Snapshot: The Numbers Behind the Growth
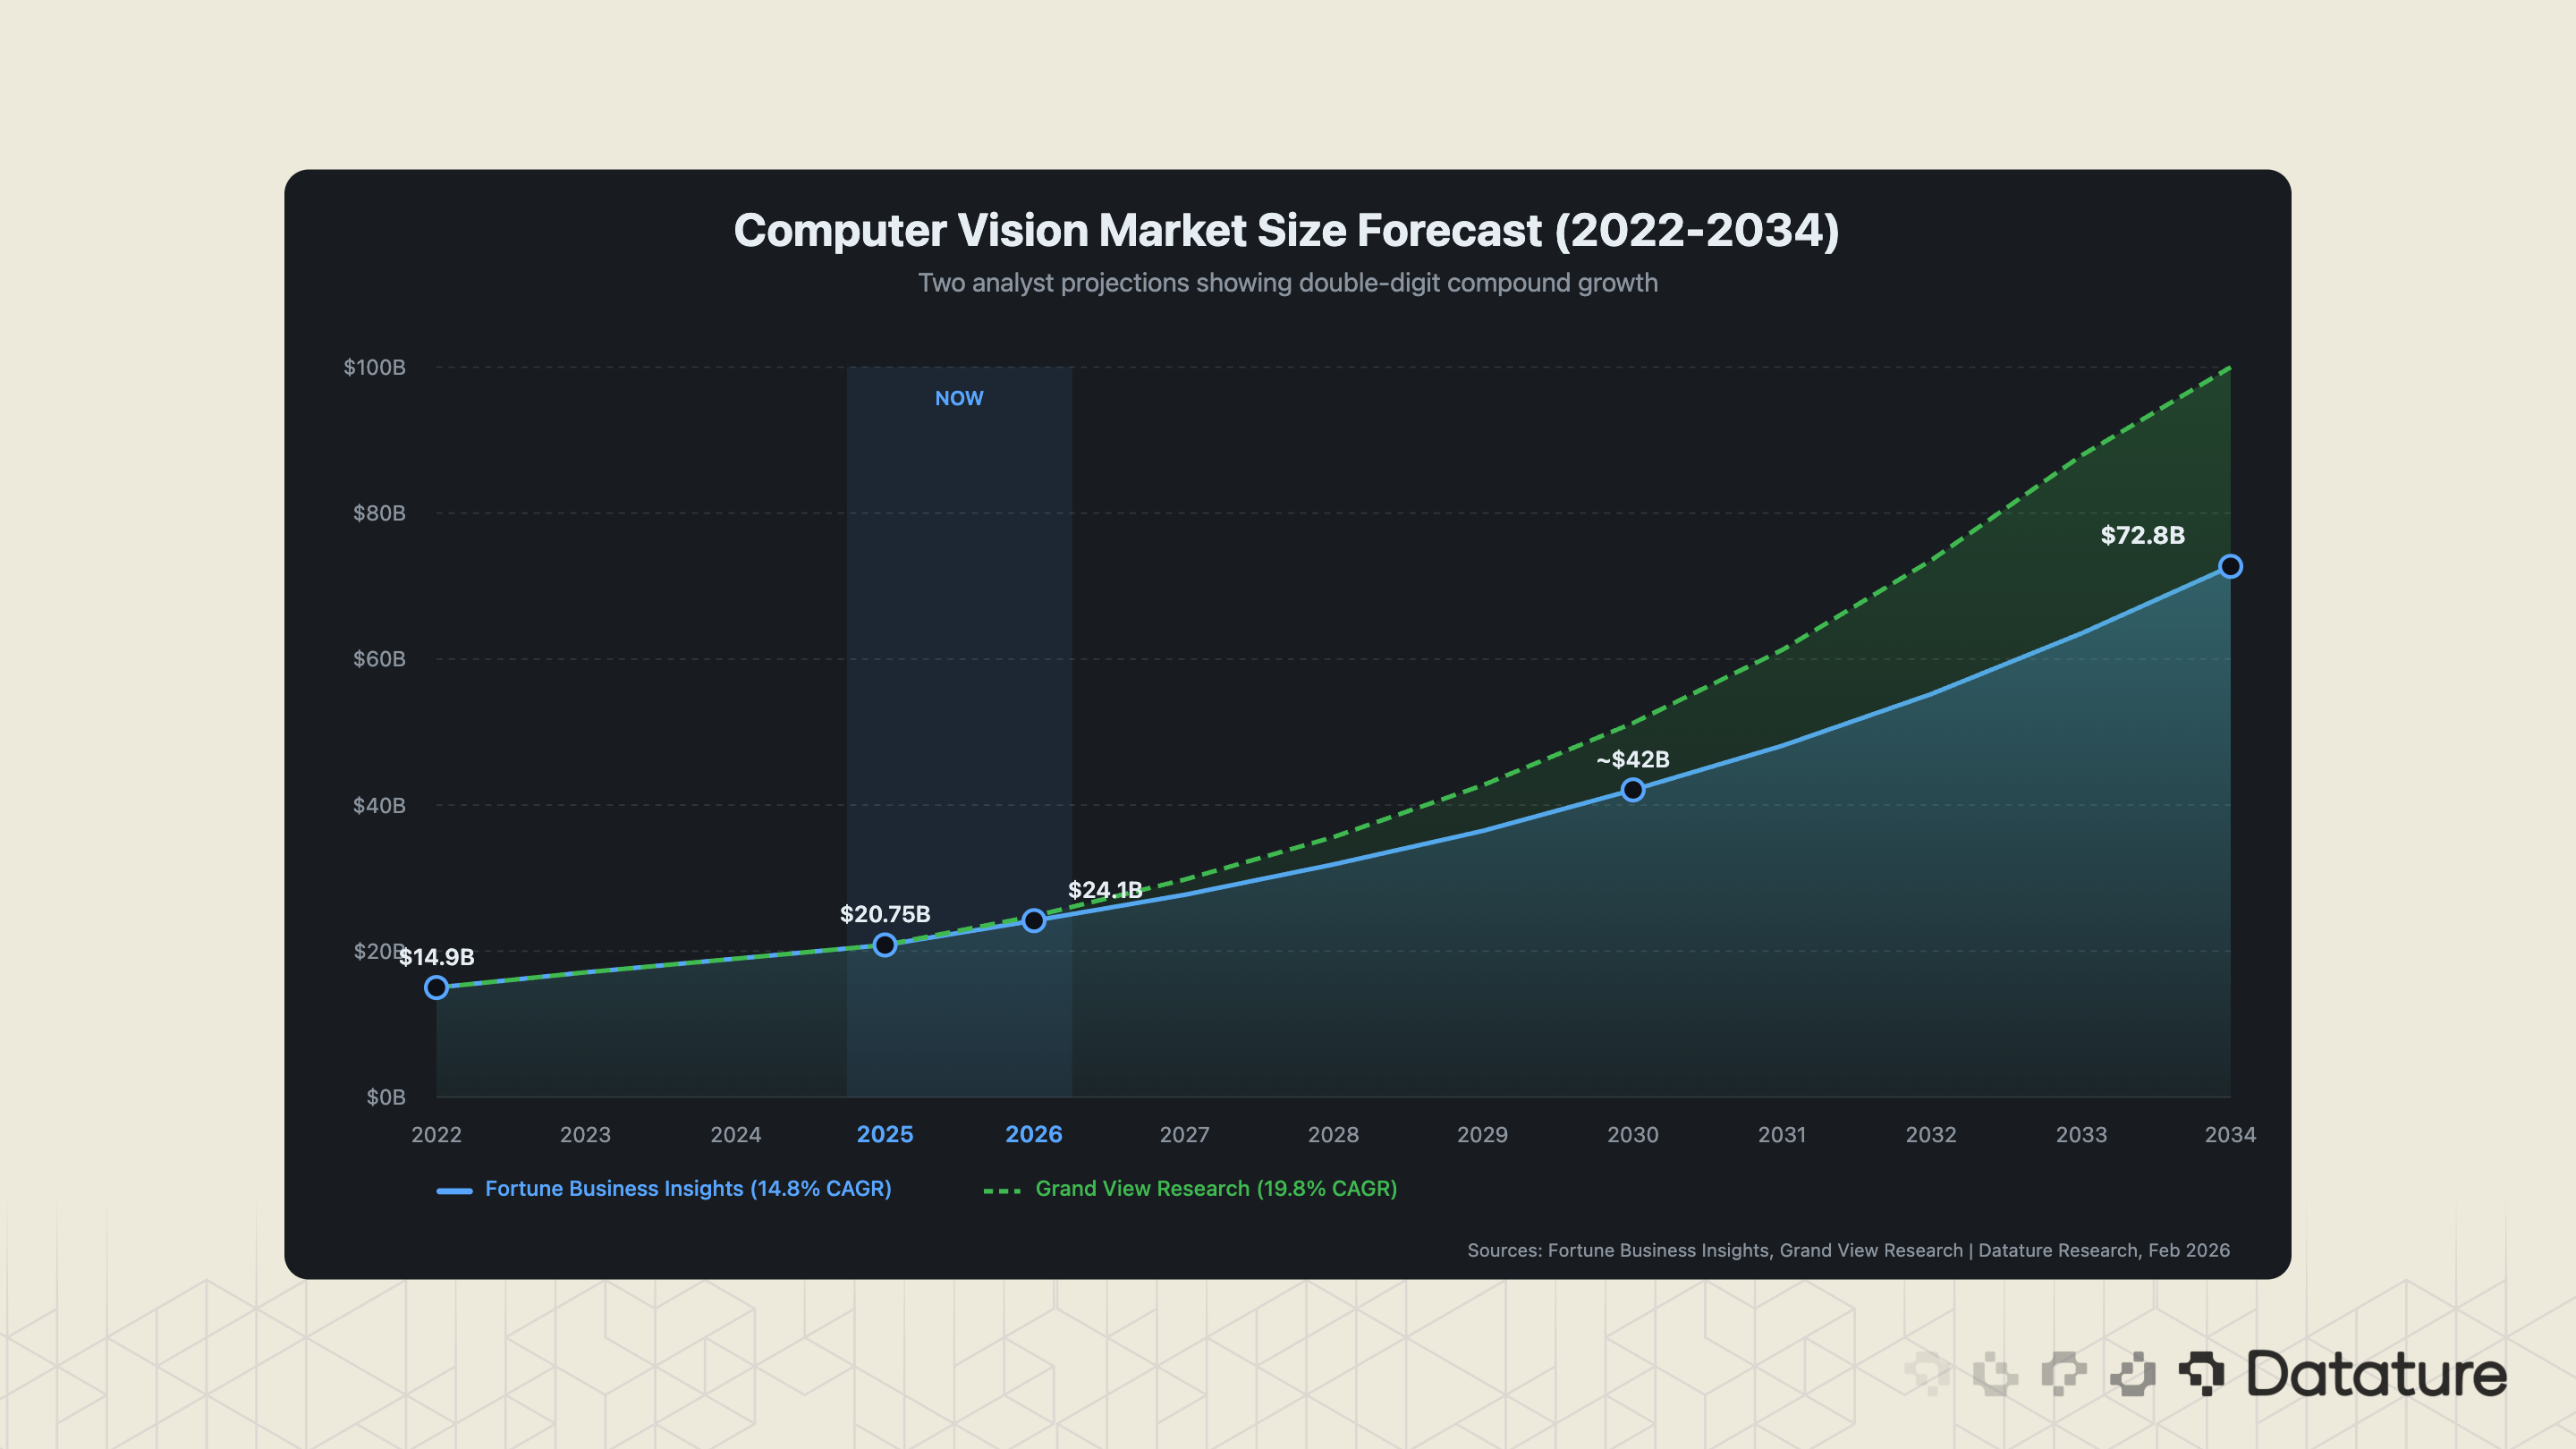
The global computer vision market is valued at $20.75 billion in 2025 (Fortune Business Insights), with projections ranging from $24.14 billion in 2026 to $72.80 billion by 2034 at a 14.8% CAGR. Grand View Research projects a steeper 19.8% CAGR through 2030. The discrepancy between analysts reflects different market boundaries - some include embedded vision hardware, others count only software - but the trajectory is consistent: double-digit compound growth for at least the next five years.
Several structural forces drive this growth. Manufacturing, which accounts for 35.1% of CV spending, is converting manual inspection lines to AI-powered systems at scale. Healthcare (27.3% of spending) is integrating medical imaging AI into clinical workflows. Security and surveillance remain steady at 26.0%. Retail, at 11.7%, is the fastest-growing segment as SKU recognition, planogram compliance, and cashierless checkout move from pilot to production.
One number that does not appear in most analyst reports but matters enormously: 34% of organizations worldwide had integrated computer vision into their operations by 2022, and the computer vision market has seen approximately 270% revenue growth over the following four years, driven by expanding deployments across manufacturing, retail, and healthcare. That means roughly one in three enterprises was already running CV in some form before the current wave of foundation models and no-code platforms hit the market. The remaining two-thirds represent the growth opportunity - and the audience most likely to adopt platform-based approaches rather than building from scratch.
Five Deployment Patterns Dominating Enterprise CV
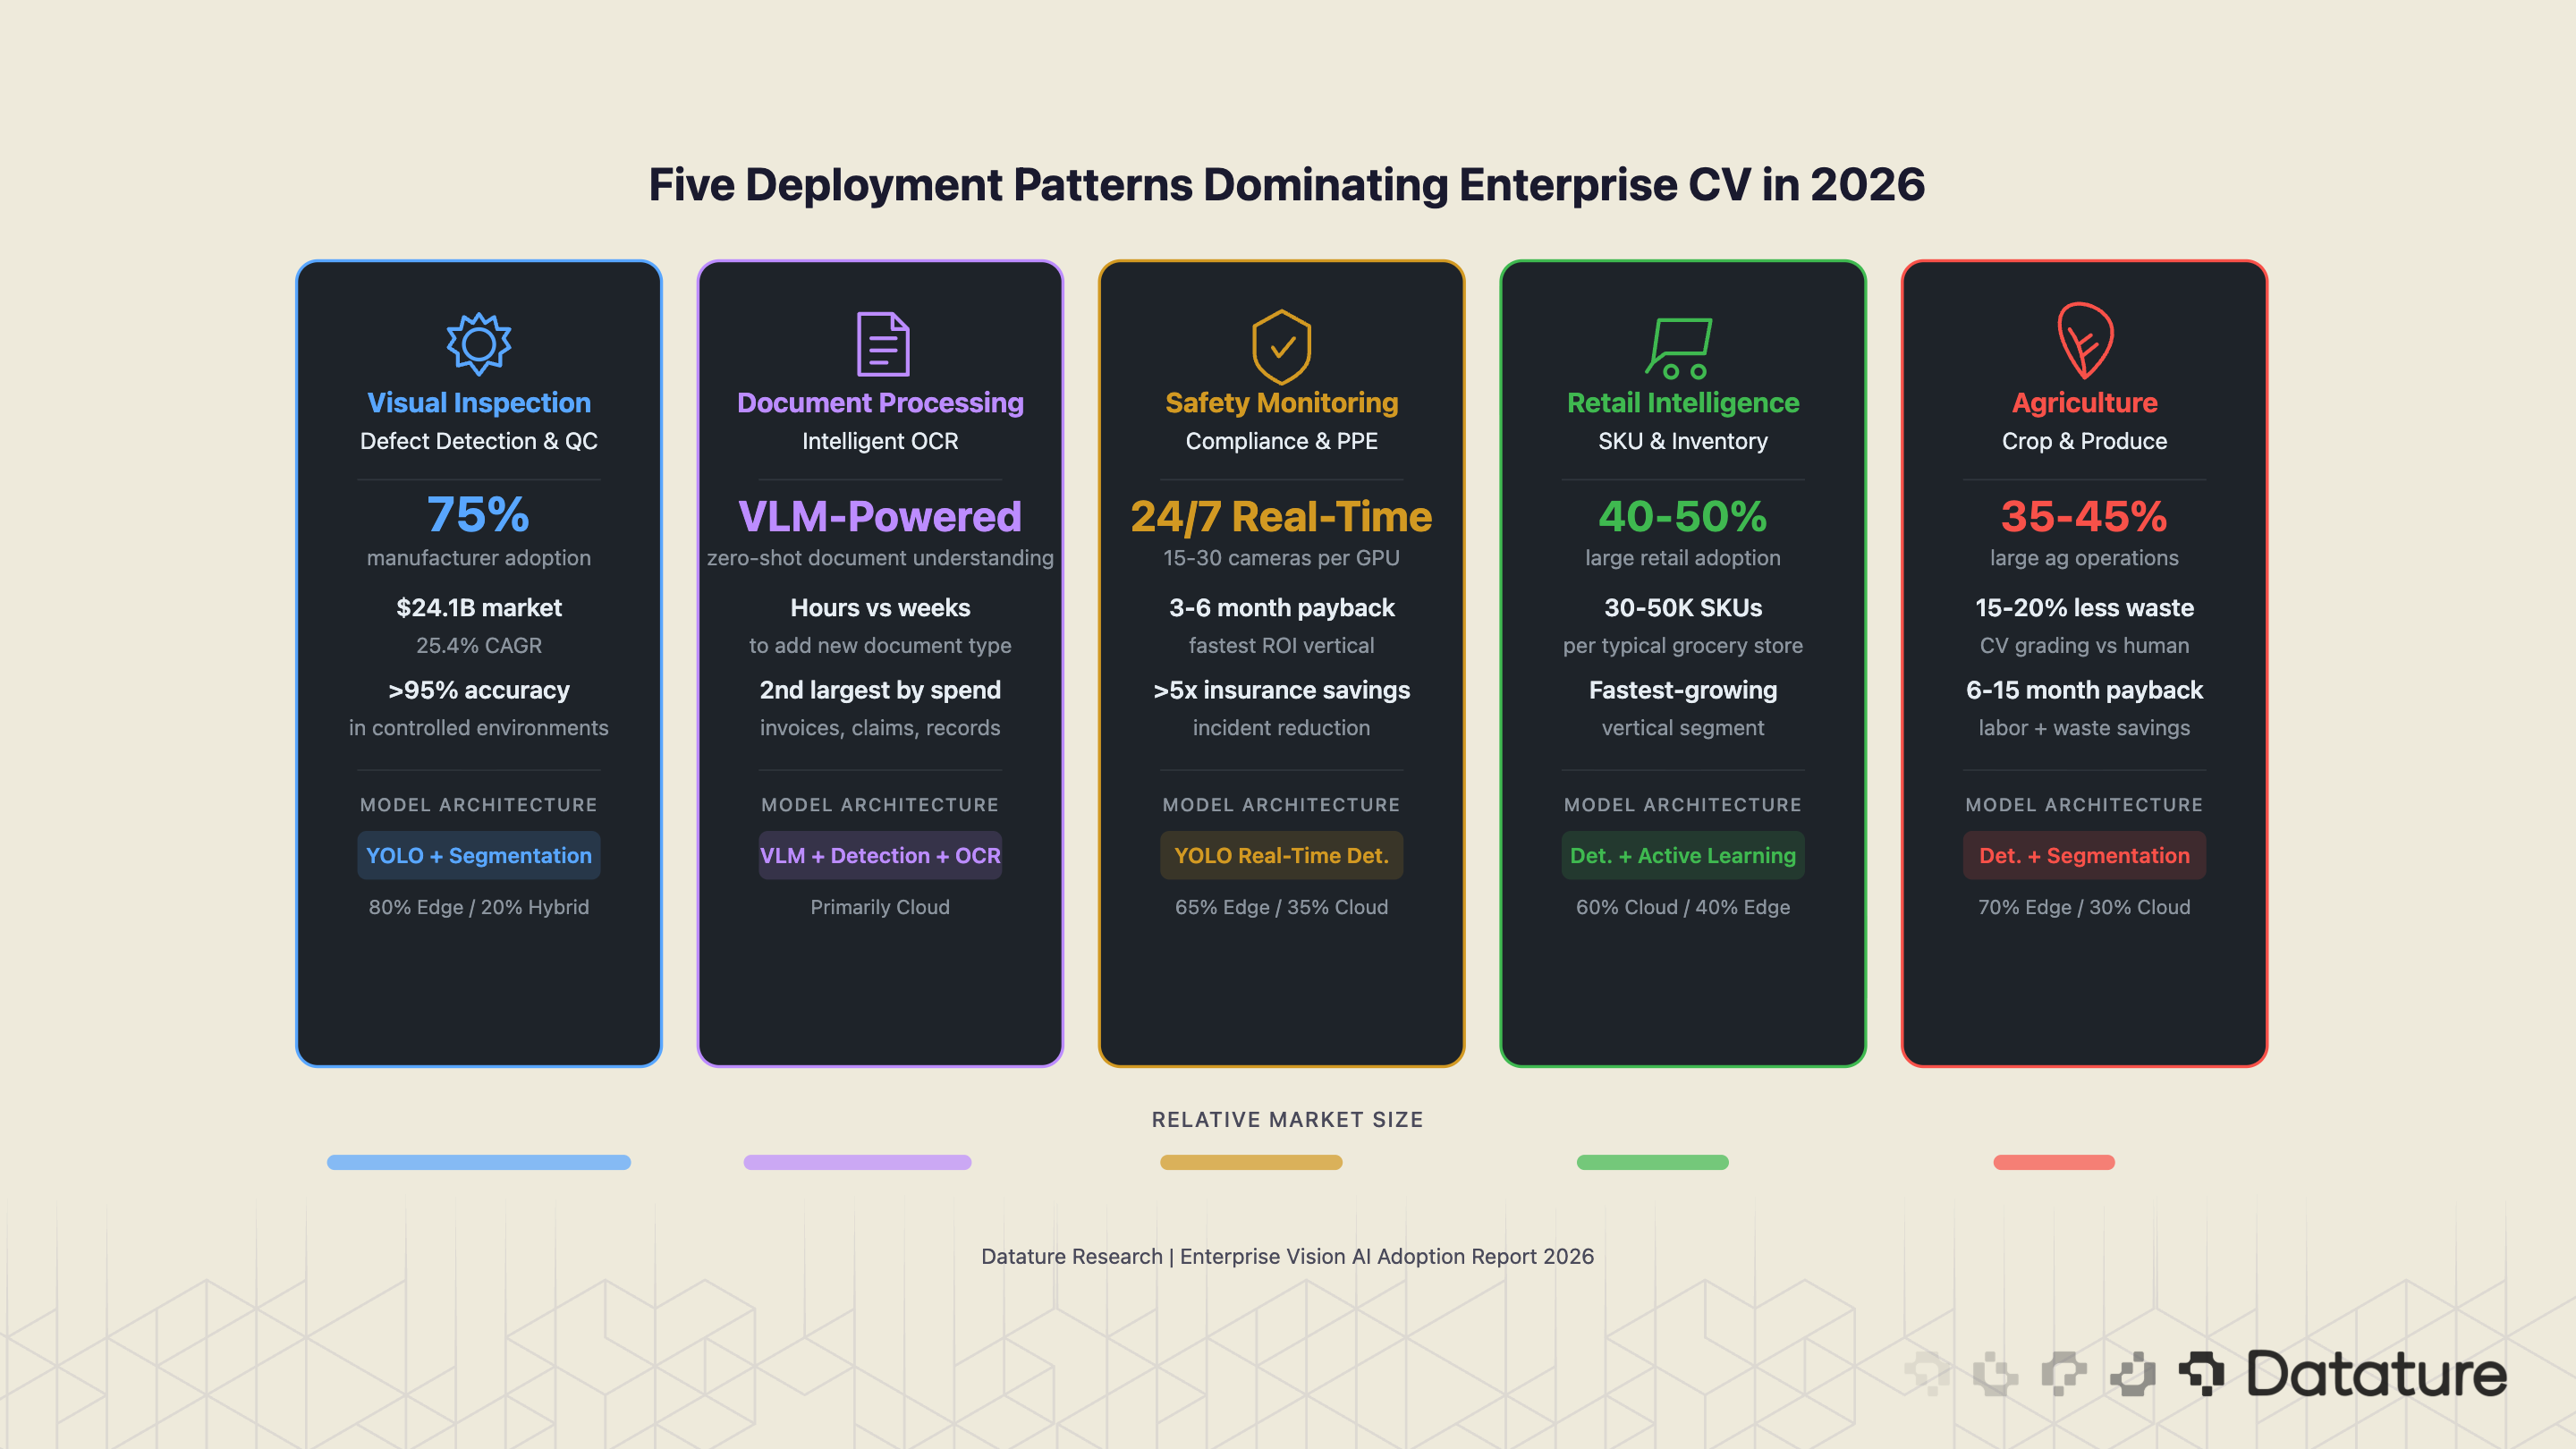
Enterprise computer vision adoption in 2026 clusters around five dominant deployment patterns. These are not aspirational use cases from analyst decks - they are the production workloads running in factories, warehouses, clinics, and fields right now. Each pattern has a distinct technical profile, data requirement, and ROI timeline.
1. Visual Inspection and Defect Detection
This is the largest enterprise CV use case by deployment count and revenue. Nearly 75% of manufacturers now run some form of AI-powered inspection, with the AI visual inspection market valued at $24.11 billion in 2024 and growing at 25.4% annually. The typical pipeline: line-scan or area-scan cameras capture images of products at production speed, a detection or segmentation model flags anomalies, and an automated reject mechanism removes defective units.
Detection accuracy in controlled manufacturing environments routinely exceeds 95%, and in some sectors (semiconductor wafer inspection, pharmaceutical blister packs) exceeds 98%. The Ingroth barrel inspection case is representative: CV replaced manual inspection of barrel surfaces for dents, cracks, and coating defects, reducing missed defect rates from 12% to under 2%. What makes this use case so dominant is not just accuracy but economics: a single undetected defect in automotive manufacturing can trigger a recall costing millions. The ROI math is straightforward.
2. Document Processing and Intelligent OCR
The second-largest pattern by enterprise spending involves extracting structured information from documents: invoices, insurance claims, medical records, shipping manifests. Traditional OCR handles clean printed text reasonably well, but enterprise documents are messy - handwritten annotations, poor scan quality, mixed layouts, stamps overlapping text. Modern CV-based document intelligence pipelines combine detection (finding text regions), segmentation (isolating fields), OCR (reading characters), and increasingly VLMs (understanding semantic relationships between fields).
VLMs are having the most visible impact in this category. Rather than building separate models for each document type, enterprises are deploying Qwen2.5-VL, GPT-4o, or Gemini-based pipelines that understand document layouts zero-shot. PaliGemma 2, while task-specific rather than a general chat model, has been fine-tuned for document-specific detection and OCR tasks in several enterprise deployments. This combination of general-purpose and fine-tuned VLMs has compressed the timeline for adding a new document type from weeks of annotation and retraining to hours of prompt engineering.
3. Safety and Compliance Monitoring
Construction sites, oil refineries, warehouses, and factory floors all require continuous monitoring for safety compliance: PPE detection (hard hats, safety vests, goggles), restricted zone intrusion, ergonomic risk assessment, and incident detection. This use case benefits from the maturity of real-time detection models—YOLO-family architectures can process 15-30 cameras simultaneously on a single edge GPU, making 24/7 monitoring economically viable.
The Trendspek structural crack detection deployment illustrates the adjacent safety inspection category: CV models trained on infrastructure imagery detect cracks, corrosion, and deformation that human inspectors miss or assess inconsistently. The growth in drone-mounted inspection (bridges, wind turbines, solar farms) is expanding this pattern rapidly.
4. Inventory and Retail Intelligence
Retail CV deployment has moved well past cashierless checkout pilots. The production use cases that are scaling: SKU recognition for automated inventory counting, planogram compliance (verifying shelf layouts match corporate plans), out-of-stock detection triggering automated reorders, and customer behavior analytics (heatmaps, dwell time, queue length). An estimated 40-50% of large retail enterprises have deployed at least one CV-based inventory or merchandising system.
The data challenge here is enormous. A typical grocery store carries 30,000-50,000 SKUs. Product packaging changes seasonally. Lighting varies by time of day. Models trained on clean product shots fail spectacularly on real shelf imagery with occlusion, reflections, and damaged labels. This is why active learning pipelines - where the model identifies its own uncertainty and requests targeted labeling - have become standard practice for retail CV.
5. Agricultural and Environmental Monitoring
Computer vision in agriculture has crossed the pilot phase. An estimated 35-45% of large agricultural operations use some form of CV-based grading or monitoring, primarily for produce quality sorting (color, size, blemish detection), crop health assessment via drone imagery, livestock monitoring, and yield estimation. The Gardyn plant growth optimization system demonstrates the pattern at consumer scale: cameras monitor individual plants, detection models identify growth stages and stress indicators, and the system adjusts light and nutrient schedules accordingly.
At industrial scale, the ROI drivers are labor cost (manual sorting is the largest operational expense for produce distributors) and waste reduction (CV-based grading reduces over-rejection by 15-20% compared to human graders who err toward caution).
Adoption by Vertical: What the Data Shows
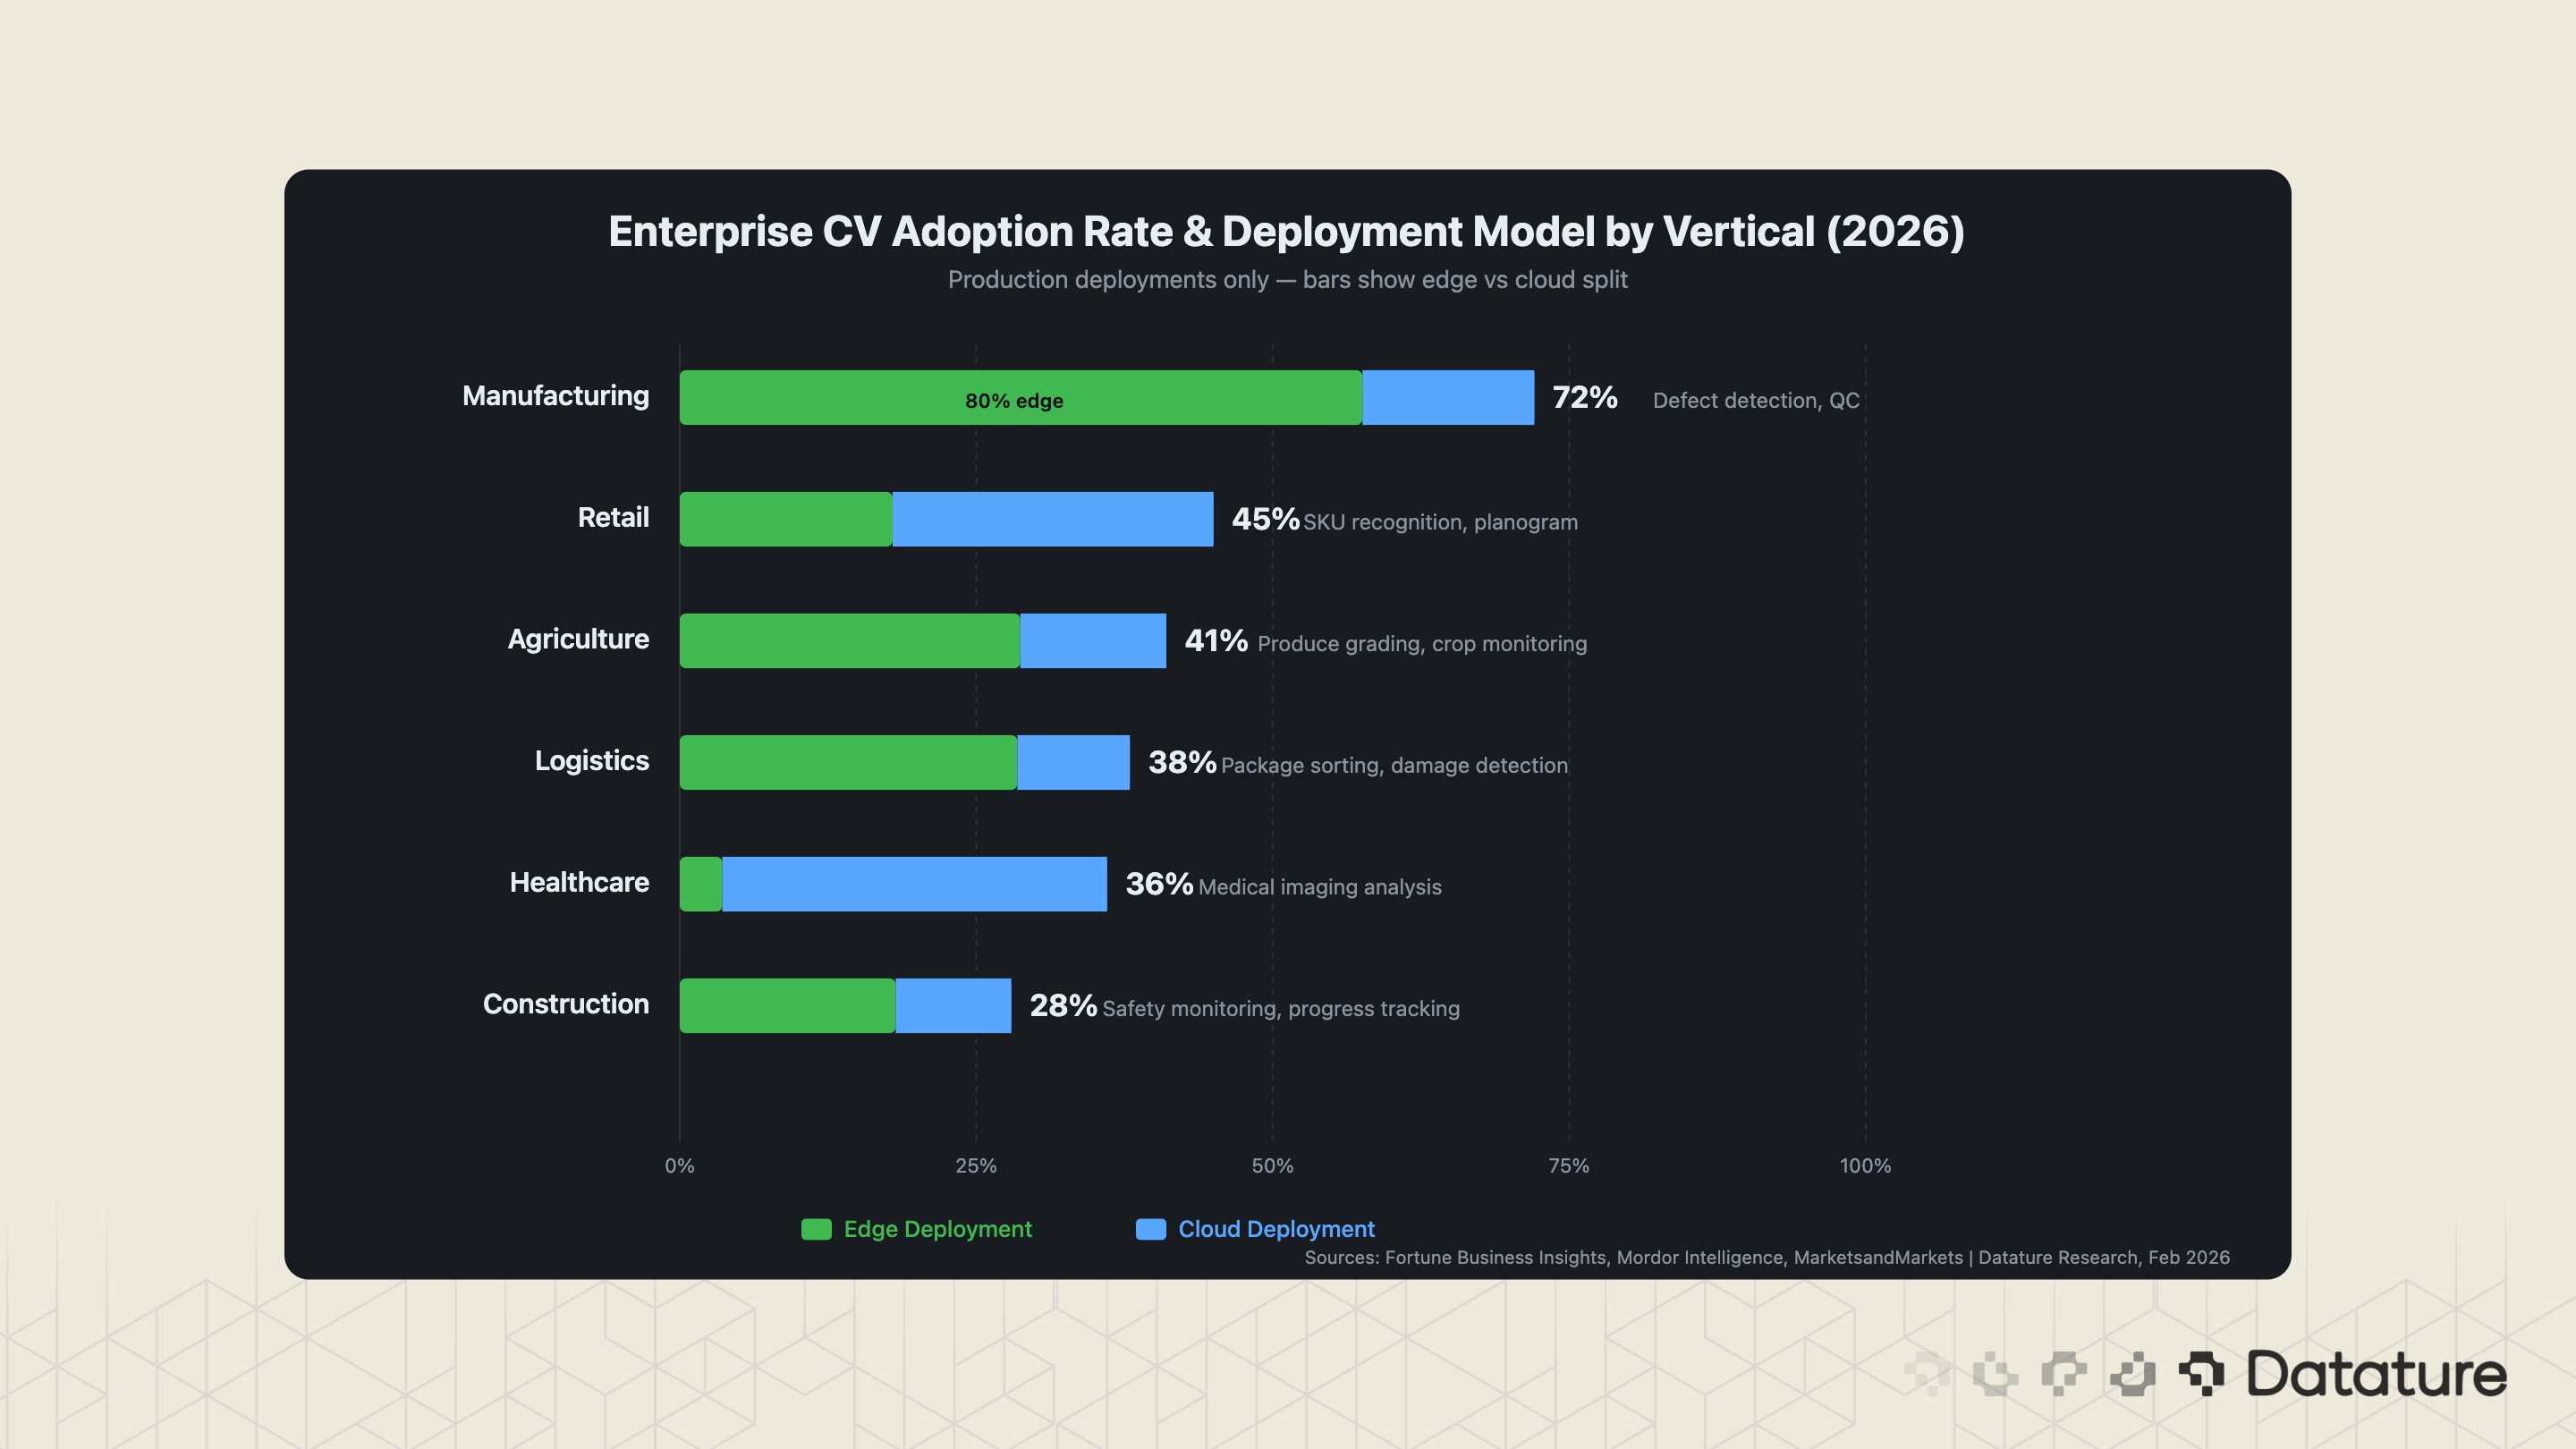
Computer vision adoption rates vary dramatically by industry. Manufacturing leads with the highest penetration, but the fastest growth is happening in retail and agriculture where the technology-readiness gap is closing quickly. The following table consolidates adoption estimates from multiple industry reports and reflects production deployments, not pilots or proofs-of-concept. Note that precise adoption rates are inherently difficult to measure across industries; the ranges below represent Datature’s synthesis of available data and should be treated as directional estimates.
Geographic Distribution
Computer vision adoption varies significantly by region. North America held approximately 34% of the global CV market in 2025 (Fortune Business Insights), driven by strong enterprise investment and cloud infrastructure maturity. Asia-Pacific accounts for roughly 28%, led by manufacturing-intensive economies in China, Japan, and South Korea where visual inspection adoption is among the highest globally. Europe represents approximately 25% of the market, with adoption patterns increasingly shaped by the EU AI Act’s compliance requirements. The remaining 13% spans Latin America, the Middle East, and Africa, where adoption is accelerating but from a lower base.
These regional differences matter for enterprise planning. Labor cost structures vary dramatically—the ROI case for automated inspection is stronger in high-wage economies where it directly replaces expensive manual labor, while in lower-wage regions, the value proposition shifts toward consistency and scalability rather than pure labor arbitrage. Regulatory environments also shape deployment architecture: GDPR and the EU AI Act push European enterprises toward on-premise and edge deployments, while the absence of comprehensive federal AI legislation in the United States allows more flexibility in cloud-based approaches.
Manufacturing: The Mature Adopter
Manufacturing is not just the largest CV market by spending - it is the most mature. The 68-75% adoption rate means that most large manufacturers have moved past the "should we use AI inspection?" question and are now in the "how do we scale it across all production lines?" phase. Electronics manufacturers account for approximately 35% of AI defect detection revenue, followed by automotive (which reports 50% faster inspection speeds with CV compared to manual methods).
The critical Insight → Manufacturing CV deployments are overwhelmingly edge-first. Latency matters when a production line runs at 500 units per minute - you cannot afford a 200ms round trip to a cloud API. This is why edge deployment on devices like the Raspberry Pi and NVIDIA Jetson has become the default architecture for inspection systems. Models are trained in the cloud, optimized via post-training quantization and pruning, and deployed to edge hardware for inference.
Healthcare: The Regulated Frontier
Healthcare CV adoption (30-40%) lags manufacturing due to regulatory requirements (FDA 510(k) for diagnostic devices, HIPAA for data handling), longer validation cycles, and the high cost of annotation by medical professionals. But the deployments that do reach production are high-value: radiology screening assistants, pathology slide analysis, surgical instrument tracking, and patient monitoring. Cloud deployment dominates (90%) because healthcare institutions typically run inference through certified, auditable cloud environments rather than on-device.
The ROI Reality Check
The return on investment for enterprise computer vision is real but unevenly distributed. Successful deployments routinely report 10-30x ROI within the first year. Failed deployments - and there are many - produce zero return and significant sunk cost. The difference between the two outcomes is almost never the model architecture. It is the data pipeline.
The Breakeven Calculation
Consider a mid-size electronics manufacturer running manual visual inspection with 12 QC technicians across two shifts. Annual fully-loaded cost: approximately $720,000. An AI inspection system (cameras, edge hardware, model development, integration) typically costs $150,000-$250,000 for the first production line, with $30,000-$50,000 for each additional line. If the system catches 30% of the defects that human inspectors miss (a conservative estimate - most production systems report 40-60%), the reduction in warranty claims and rework alone covers the investment in 6-9 months.
The less obvious ROI comes from consistency. Human inspectors fatigue. Their defect catch rate drops 15-20% over an 8-hour shift. CV models do not fatigue. A system running at 92% accuracy 24/7 outperforms a human team averaging 96% accuracy for the first two hours and 78% accuracy by hour six.
ROI by Deployment Type
Manufacturing Inspection ~6-12 month payback, 10-30x first-year ROI in defect cost avoidance
Retail Inventory ~9-18 month payback, 3-8x ROI through out-of-stock reduction and labor savings
Safety Monitoring ~3-6 month payback, ROI measured in incident reduction (hard to quantify but often exceeds 5x in insurance savings)
Document Processing ~6-12 month payback, 5-15x ROI through processing speed and error reduction

Why a 50% Accuracy Model Can Still Be Profitable
One of the most counterintuitive findings: in many manufacturing contexts, a model with just 50% defect detection accuracy is still net positive. If the baseline is no automated inspection (defects caught only at final QC or by customers), even a mediocre model catching half the defects upstream saves more in rework cost than the system costs to operate. The confusion matrix math is straightforward: the cost of a false negative (missed defect reaching customer) typically exceeds the cost of a false positive (good unit incorrectly rejected) by 10-100x. This asymmetry means that even noisy models create value.
A concrete example: consider a consumer electronics line producing 10,000 units per day with a 2% defect rate (200 defective units). If a false negative costs $10,000 (warranty claim, product return, brand damage) and a false positive costs $50 (unit re-inspected and re-routed), a model with 50% recall and 80% precision catches 100 of the 200 defects, saving $1,000,000 per day in avoided false negatives while incurring only $1,250 per day in false positive re-inspection costs (25 false positives at $50 each). Even at these modest accuracy numbers, the system generates approximately $250M in annual net savings on a $200K investment.
The practical implication: enterprises should deploy early and iterate, not wait for a 99% accuracy model that never ships. The best production CV systems started at 80-85% accuracy and improved to 95%+ through active learning over 3-6 months of production data collection.
Technology Choices Enterprises Are Making
The model architecture landscape for enterprise CV in 2026 has consolidated around a smaller number of proven choices than it had two years ago. The "which model should we use?" question now has relatively clear answers based on deployment constraints. Here is what enterprises are actually choosing and why.
YOLO26 vs. RF-DETR: The Detection Architecture Split
The two dominant real-time detection architectures in production are YOLO26 and RF-DETR. They serve different operational needs and the choice between them follows a clear decision boundary.
YOLO26 is the preferred architecture for latency-critical edge deployments. Its NMS-free design and removal of the Distribution Focal Loss (DFL) module make it optimized for edge and low-power devices. YOLO26 supports five core tasks (detection, instance segmentation, pose estimation, oriented bounding boxes, and classification) in a single architecture. Beyond the architectural streamlining, YOLO26 introduces two key training innovations: ProgLoss (Progressive Loss Balancing), which adaptively reweights loss objectives to prevent easy examples from dominating late-stage training, and STAL (Small-Target-Aware Label Assignment), which prioritizes assignment for small and occluded objects - directly addressing the most common failure mode in manufacturing inspection.
RF-DETR, built on a DINOv2 vision transformer backbone, offers superior accuracy in complex multi-class environments. RF-DETR-L achieves 60.5 mAP on COCO at 25 FPS - the first real-time model to break 60 mAP on that benchmark - and also leads on the RF100-VL diverse-domain benchmark, outperforming YOLO26 on generalization across domains. For document processing, fine-grained classification, and deployments where accuracy matters more than single-digit-millisecond latency, RF-DETR is the stronger choice.
For teams evaluating these options, the Datature blog has detailed coverage of the YOLO architecture evolution and D-FINE's approach to object detection.
Edge vs. Cloud: The Deployment Split
The edge-versus-cloud deployment split has shifted decisively toward edge in 2026. Over 50% of new enterprise CV model deployments now run on edge devices, up from roughly 30% in 2023. Gartner has projected that up to 75% of enterprise data will be created and processed outside traditional data centers, a trend accelerating through 2030. In the United States, 97% of CIOs have included edge AI in their 2025-2026 technology roadmaps, and 90% of enterprises are increasing edge AI budgets.
The drivers are practical, not theoretical: manufacturing inspection requires sub-10ms latency, healthcare data cannot leave the hospital network (HIPAA, GDPR), agricultural monitoring happens in fields without reliable connectivity, and the cost of streaming high-resolution video to a cloud API is prohibitive at scale. Organizations running edge inference report 30-40% energy cost savings and latency under 10 milliseconds.
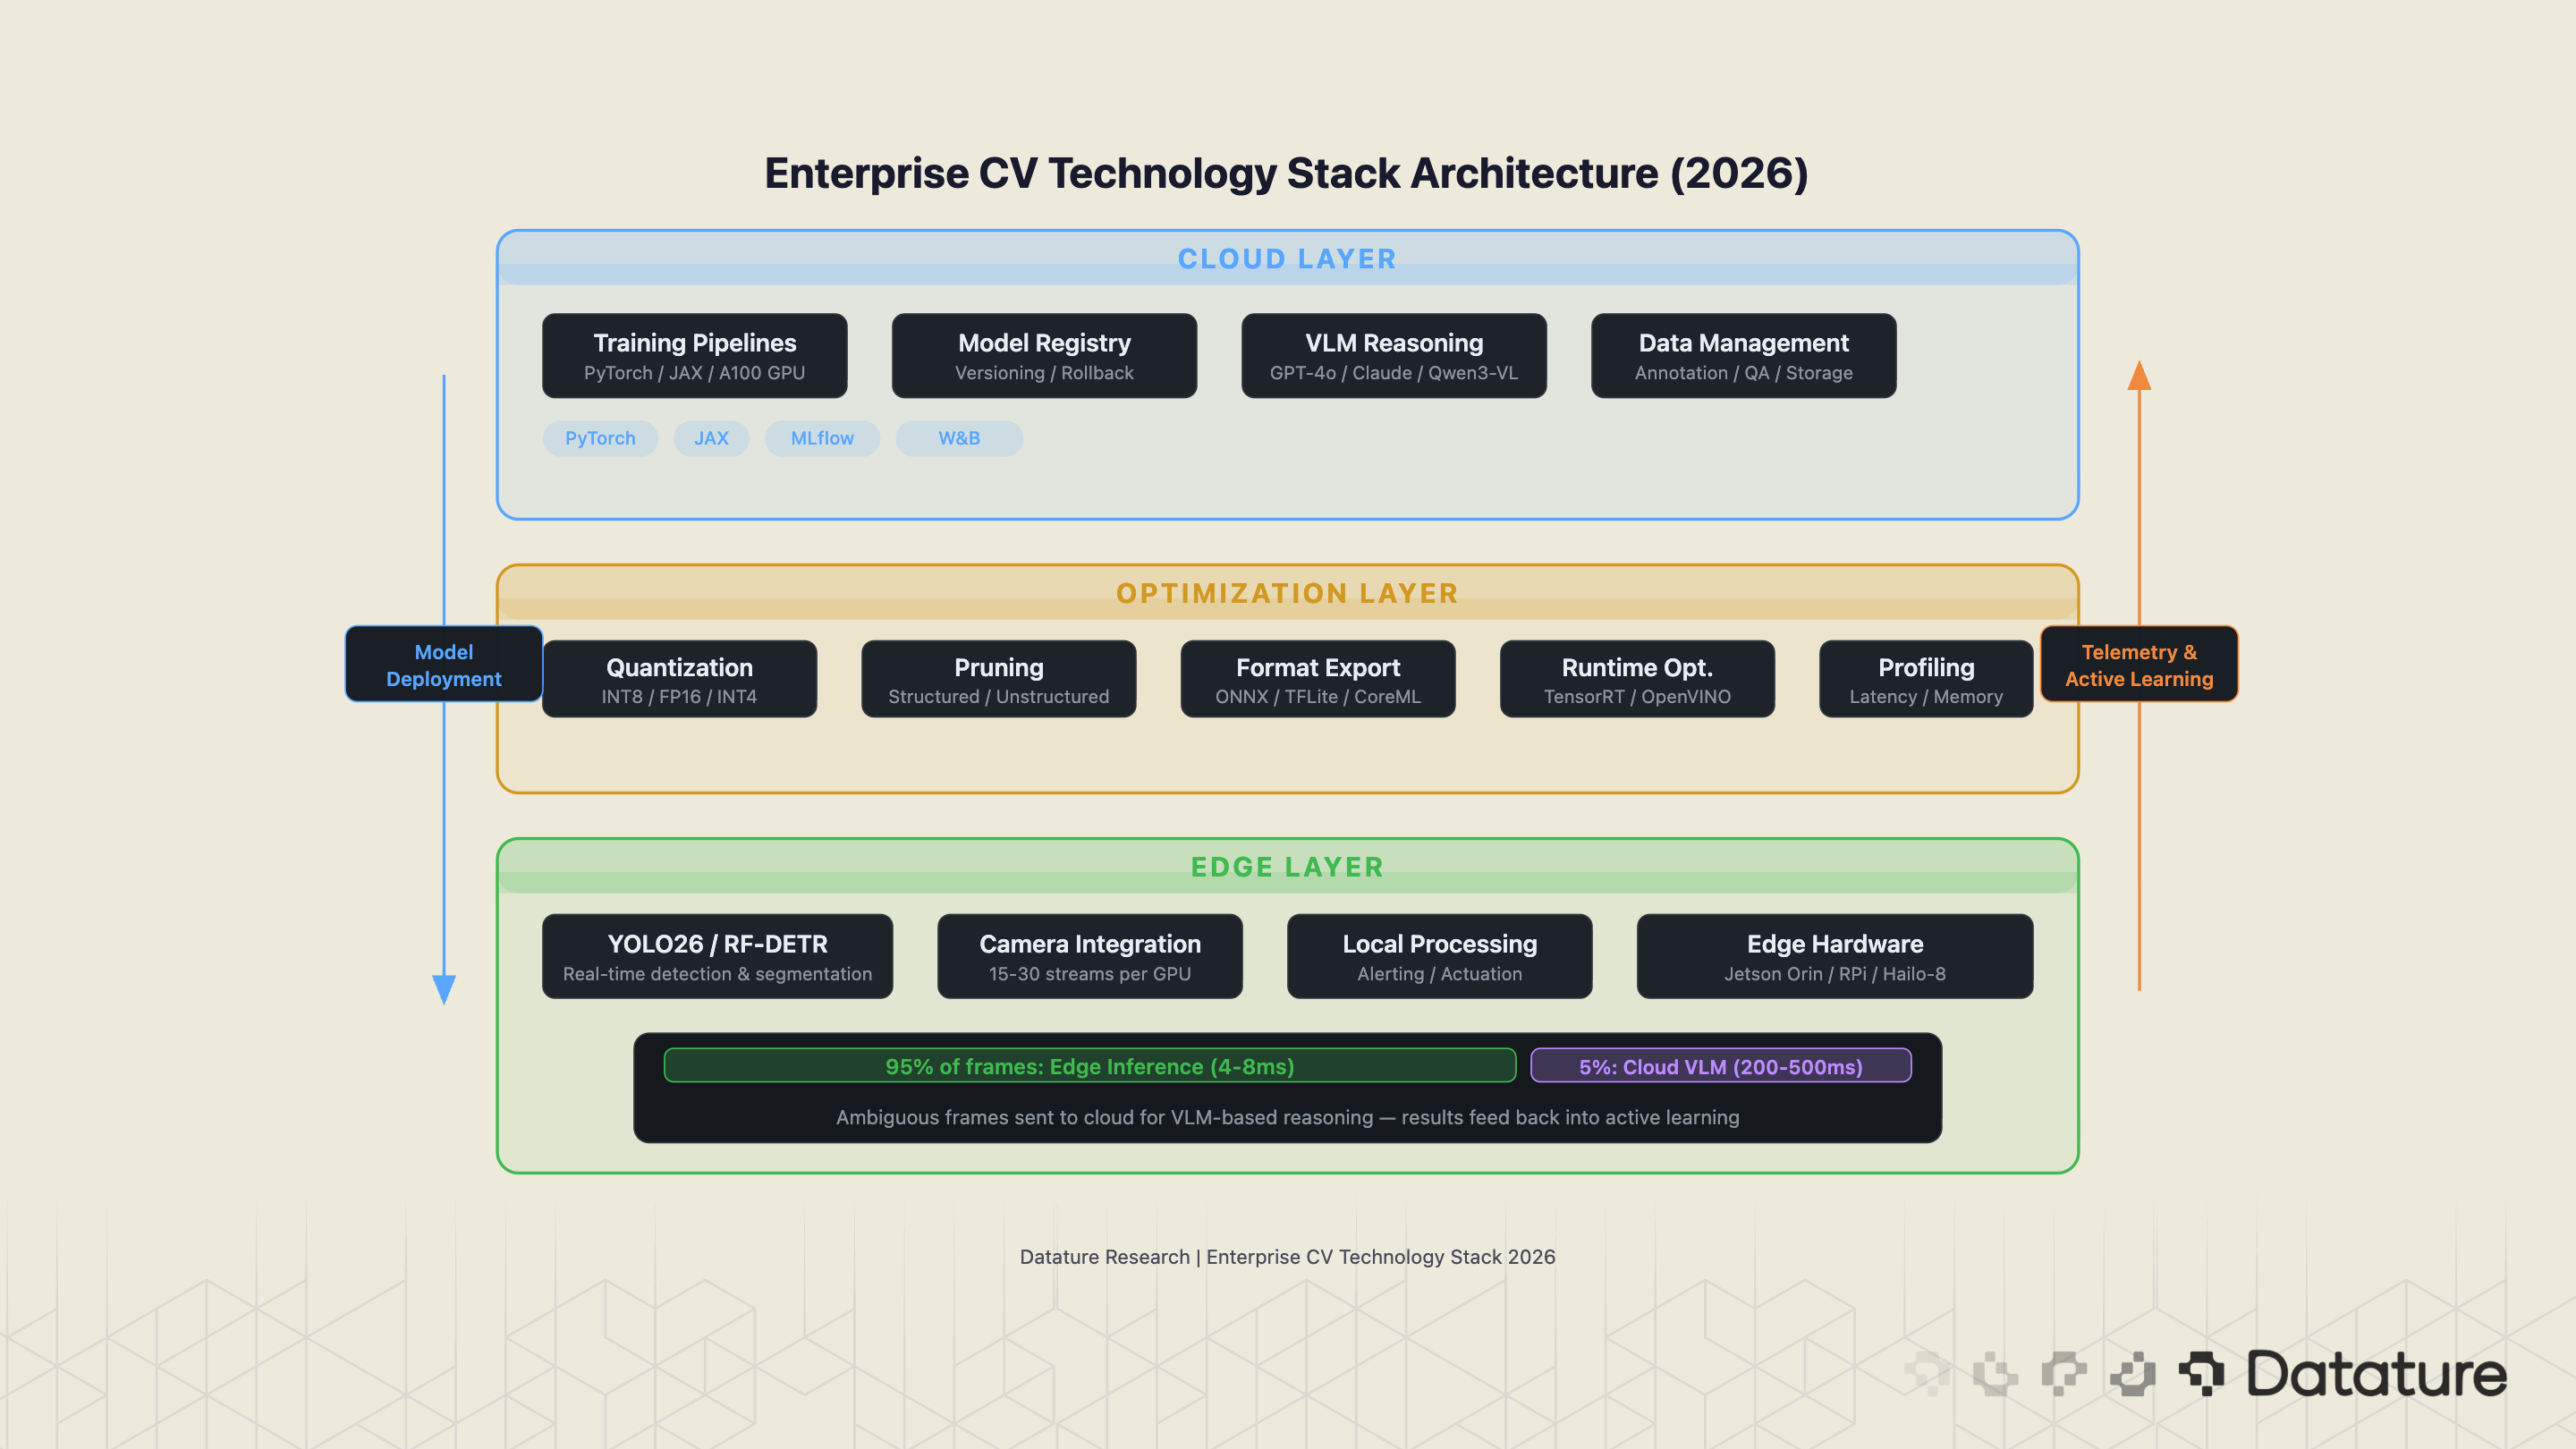
The Hybrid Architecture
Most mature enterprise deployments use a hybrid approach → Lightweight detection and segmentation models run on-device for real-time inference, while training, model updates, and VLM-based reasoning happen in the cloud. The edge device handles the 95% of frames that match known patterns; the remaining 5% (ambiguous cases, novel defect types) are sent to a cloud endpoint for VLM-based analysis.
Compute Cost Considerations
Enterprise CV planning requires realistic compute cost estimates for both training and inference. Training a YOLO26 detection model on a custom dataset of 10,000 images typically requires 4-8 hours on a single A100 GPU, costing approximately $15-30 in cloud compute (AWS, GCP, or Azure spot pricing). Larger datasets or segmentation tasks scale linearly: 50,000 images at higher resolution may require 2-3 days and $100-200 in GPU time. RF-DETR, with its transformer backbone, runs approximately 1.5-2x the training cost of YOLO26 for equivalent dataset sizes.
Inference cost diverges sharply between cloud and edge. A 15-camera safety monitoring system running YOLO26 on NVIDIA Jetson Orin edge devices costs approximately $200/month in amortized hardware (assuming a 3-year hardware lifecycle) with zero ongoing cloud compute costs. The equivalent workload on cloud GPU instances (processing 15 streams at 15-30 FPS) runs $800-1,500/month depending on instance type and region. Over three years, the edge deployment costs roughly $7,200 in total versus $29,000-54,000 for cloud - a 4-7x cost advantage that compounds as camera count increases.
VLMs in Enterprise: Augmentation, Not Replacement
The VLM market reached $3.84 billion in 2025 and is projected to grow at 26.95% CAGR through 2035 (Astute Analytica). Over 40% of new VLM deployments are occurring at the edge. But the enterprise reality is more nuanced than the hype suggests: VLMs are augmenting traditional CV pipelines, not replacing them.
In production, the pattern looks like this: structured detection tasks (counting objects, measuring dimensions, classifying known categories) still run on YOLO or DETR architectures because they are faster, cheaper, and more deterministic. VLMs handle the unstructured reasoning: "Is this a new type of defect we have not seen before?", "Does this document layout match the expected template?", "Describe what is wrong with this product image in natural language for the QC report." In practice, GPT-4o and Claude are the most commonly deployed VLMs for enterprise visual reasoning tasks due to their combined vision and tool-calling capabilities, while Qwen3-VL and Pixtral Large are emerging as strong open-source alternatives for organizations requiring on-premise deployment. The combination of specialized detection models and general-purpose VLMs is more powerful than either alone.
The No-Code vs. Custom Engineering Debate
Organizations using no-code or low-code CV platforms report 50-70% faster development cycles and up to 90% reduction in time-to-deployment compared to custom engineering approaches (Kissflow, 2026). The question is not whether platform-based approaches are faster - they clearly are. The question is when the tradeoff is worth it.
When No-Code Wins
No-code CV platforms are the right choice for 60-70% of enterprise use cases. Specifically: when the task is a standard CV problem (classification, object detection, instance segmentation) with established model architectures; when the team includes domain experts (manufacturing engineers, agricultural scientists, medical professionals) who understand the data but are not ML engineers; when time-to-deployment matters more than squeezing the last 2% of accuracy; and when the deployment target is a supported edge device or cloud API.
The economics reinforce this. Gartner forecasts that 75% of large enterprises will employ at least four low-code development tools by 2026. Organizations report average annual savings of $187,000 per no-code deployment, with payback periods of 6-12 months. The investment in vision AI platforms, particularly no-code, edge-ready platforms, is often recouped within 12-24 months.
When Custom Engineering Is Necessary
The remaining 30-40% of enterprise CV needs require custom ML engineering. These include: novel architectures not supported by existing platforms (3D point cloud processing, video understanding with temporal models, multi-modal pipelines combining vision and sensor data); extreme accuracy requirements where the difference between 97% and 99.2% mAP has material safety or financial implications; custom hardware targets (FPGAs, specialized ASICs, embedded systems with non-standard runtimes); and research-oriented deployments where the team needs to modify model internals, implement custom loss functions, or conduct architecture search.
Why Enterprise CV Projects Fail
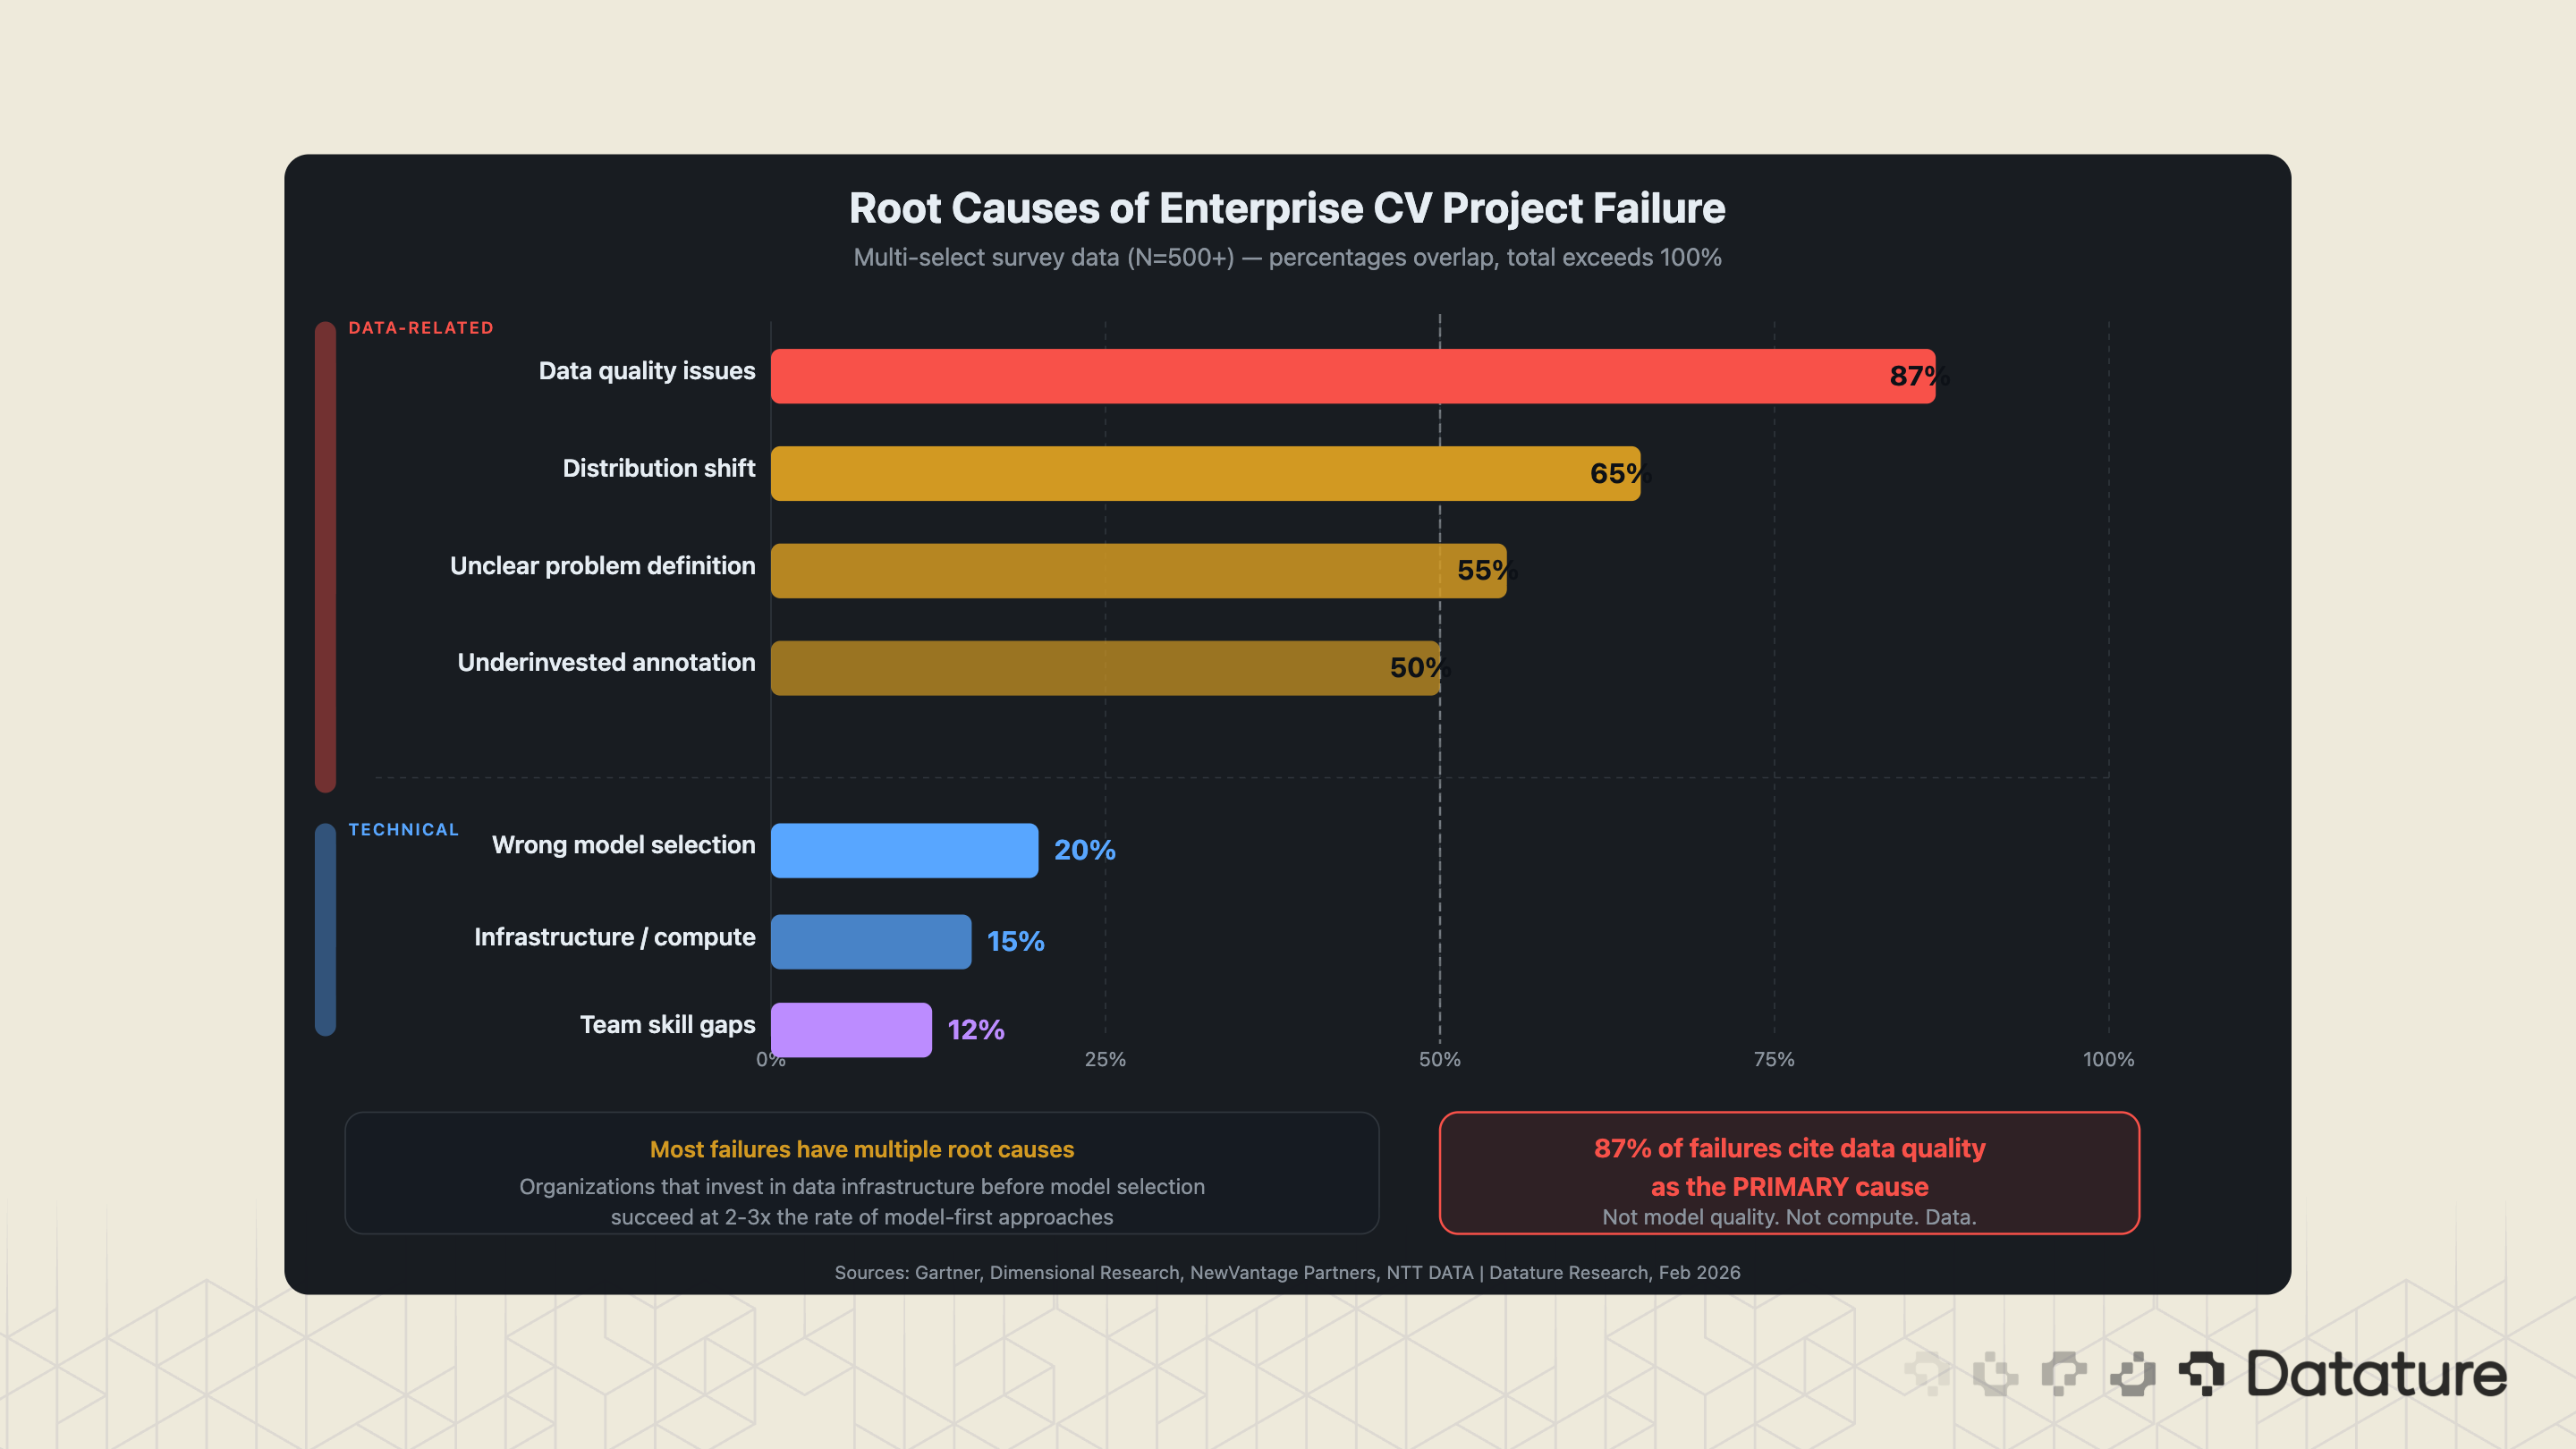
Between 70-85% of enterprise AI projects fail to meet ROI expectations (NTT DATA, 2024). A 2025 MIT study found that 95% of enterprise generative AI pilots failed to deliver measurable value - and while that study focused on GenAI specifically, the failure patterns it identified (data quality, organizational readiness, unclear problem definition) are equally prevalent in computer vision deployments. S&P Global reports that 42% of companies scrapped most of their AI initiatives in 2025, up from 17% the year prior. The average organization abandoned 46% of AI proofs-of-concept before reaching production. The failure modes in CV are consistent and predictable.
Failure Mode 1: Starting with Model Architecture Instead of Data
The single most common failure pattern: an enterprise selects a model (usually whatever is newest on the Hugging Face trending page), collects whatever data is easy to acquire, and is surprised when the model underperforms in production. The correct order is reversed. Start with the problem definition, work backward to data requirements, design the annotation schema, build the data pipeline, and then select a model that fits the data characteristics and deployment constraints.
Failure Mode 2: Ignoring Distribution Shift
A model trained on daytime factory images fails on the night shift when the lighting changes. A retail shelf recognition model trained in one store chain fails when deployed to a chain with different shelving heights. A produce grading model trained on Washington apples fails on New Zealand apples. Distribution shifts - the gap between training data and production data - is the second most common cause of CV deployment failure, and it is almost always underestimated.
The mitigation is continuous monitoring. Production CV systems need performance tracking that flags accuracy degradation in real time, combined with active learning loops that automatically route low-confidence predictions back for human review and model retraining.
Failure Mode 3: Underinvesting in Annotation
Annotation is the least glamorous part of the CV pipeline and the most consequential. Enterprises that allocate 60-70% of their CV budget to model development and only 10-20% to annotation get the ratio backward. The organizations that succeed allocate 40-50% of their budget to data collection, annotation, and quality assurance. They invest in annotation tooling with built-in quality controls, use consensus algorithms to verify inter-annotator agreement, and treat the annotation pipeline as a first-class engineering system.
Annotation Cost Reality
Manual Bounding Box Annotation ~ $0.05-$0.15 per object
Polygon Segmentation Annotation ~ $0.20-$1.00 per object
Medical Image Annotation ~ $5-$50 per scan
Failure Mode 4: Skipping the Feedback Loop
The most successful enterprise CV deployments are not the ones that launch with the highest accuracy. They are the ones with the tightest feedback loop between production performance and model improvement. A system that launches at 85% accuracy but has automated monitoring, human-in-the-loop review, and weekly retraining cycles will outperform a system that launches at 95% accuracy and never improves. Production data is the most valuable training data you will ever have, and most enterprises throw it away.
The MLOps Requirement
Failure Modes 2 and 4 both point to a deeper infrastructure gap: most enterprises lack the MLOps systems needed to maintain production CV at scale. A model that performs well at launch degrades over time as production conditions drift, and without automated monitoring, teams do not notice until accuracy has dropped significantly. Enterprise-grade CV requires four operational capabilities: a model registry with versioning to track what is deployed where and enable instant rollback; automated drift detection that monitors input data distributions and prediction confidence in real time; CI/CD for model updates that validates new models against held-out test sets before deployment, including shadow deployment patterns where new models run alongside production models without affecting outputs; and automated retraining triggers that initiate model updates when drift metrics exceed thresholds.
Organizations that invest in these MLOps fundamentals report 2-3x longer production lifespans for their CV models and significantly fewer unplanned model failures. The upfront cost is real - typically 15-20% of the initial CV project budget - but the alternative is models that quietly degrade in production until someone notices a spike in customer complaints.
What We See on the Datature Platform
Understanding these failure patterns is what shapes the tooling and workflows on production CV platforms. At Datature, we see these patterns play out in aggregate across our user base - and the platform telemetry offers a unique window into how enterprises are actually building and deploying computer vision today.
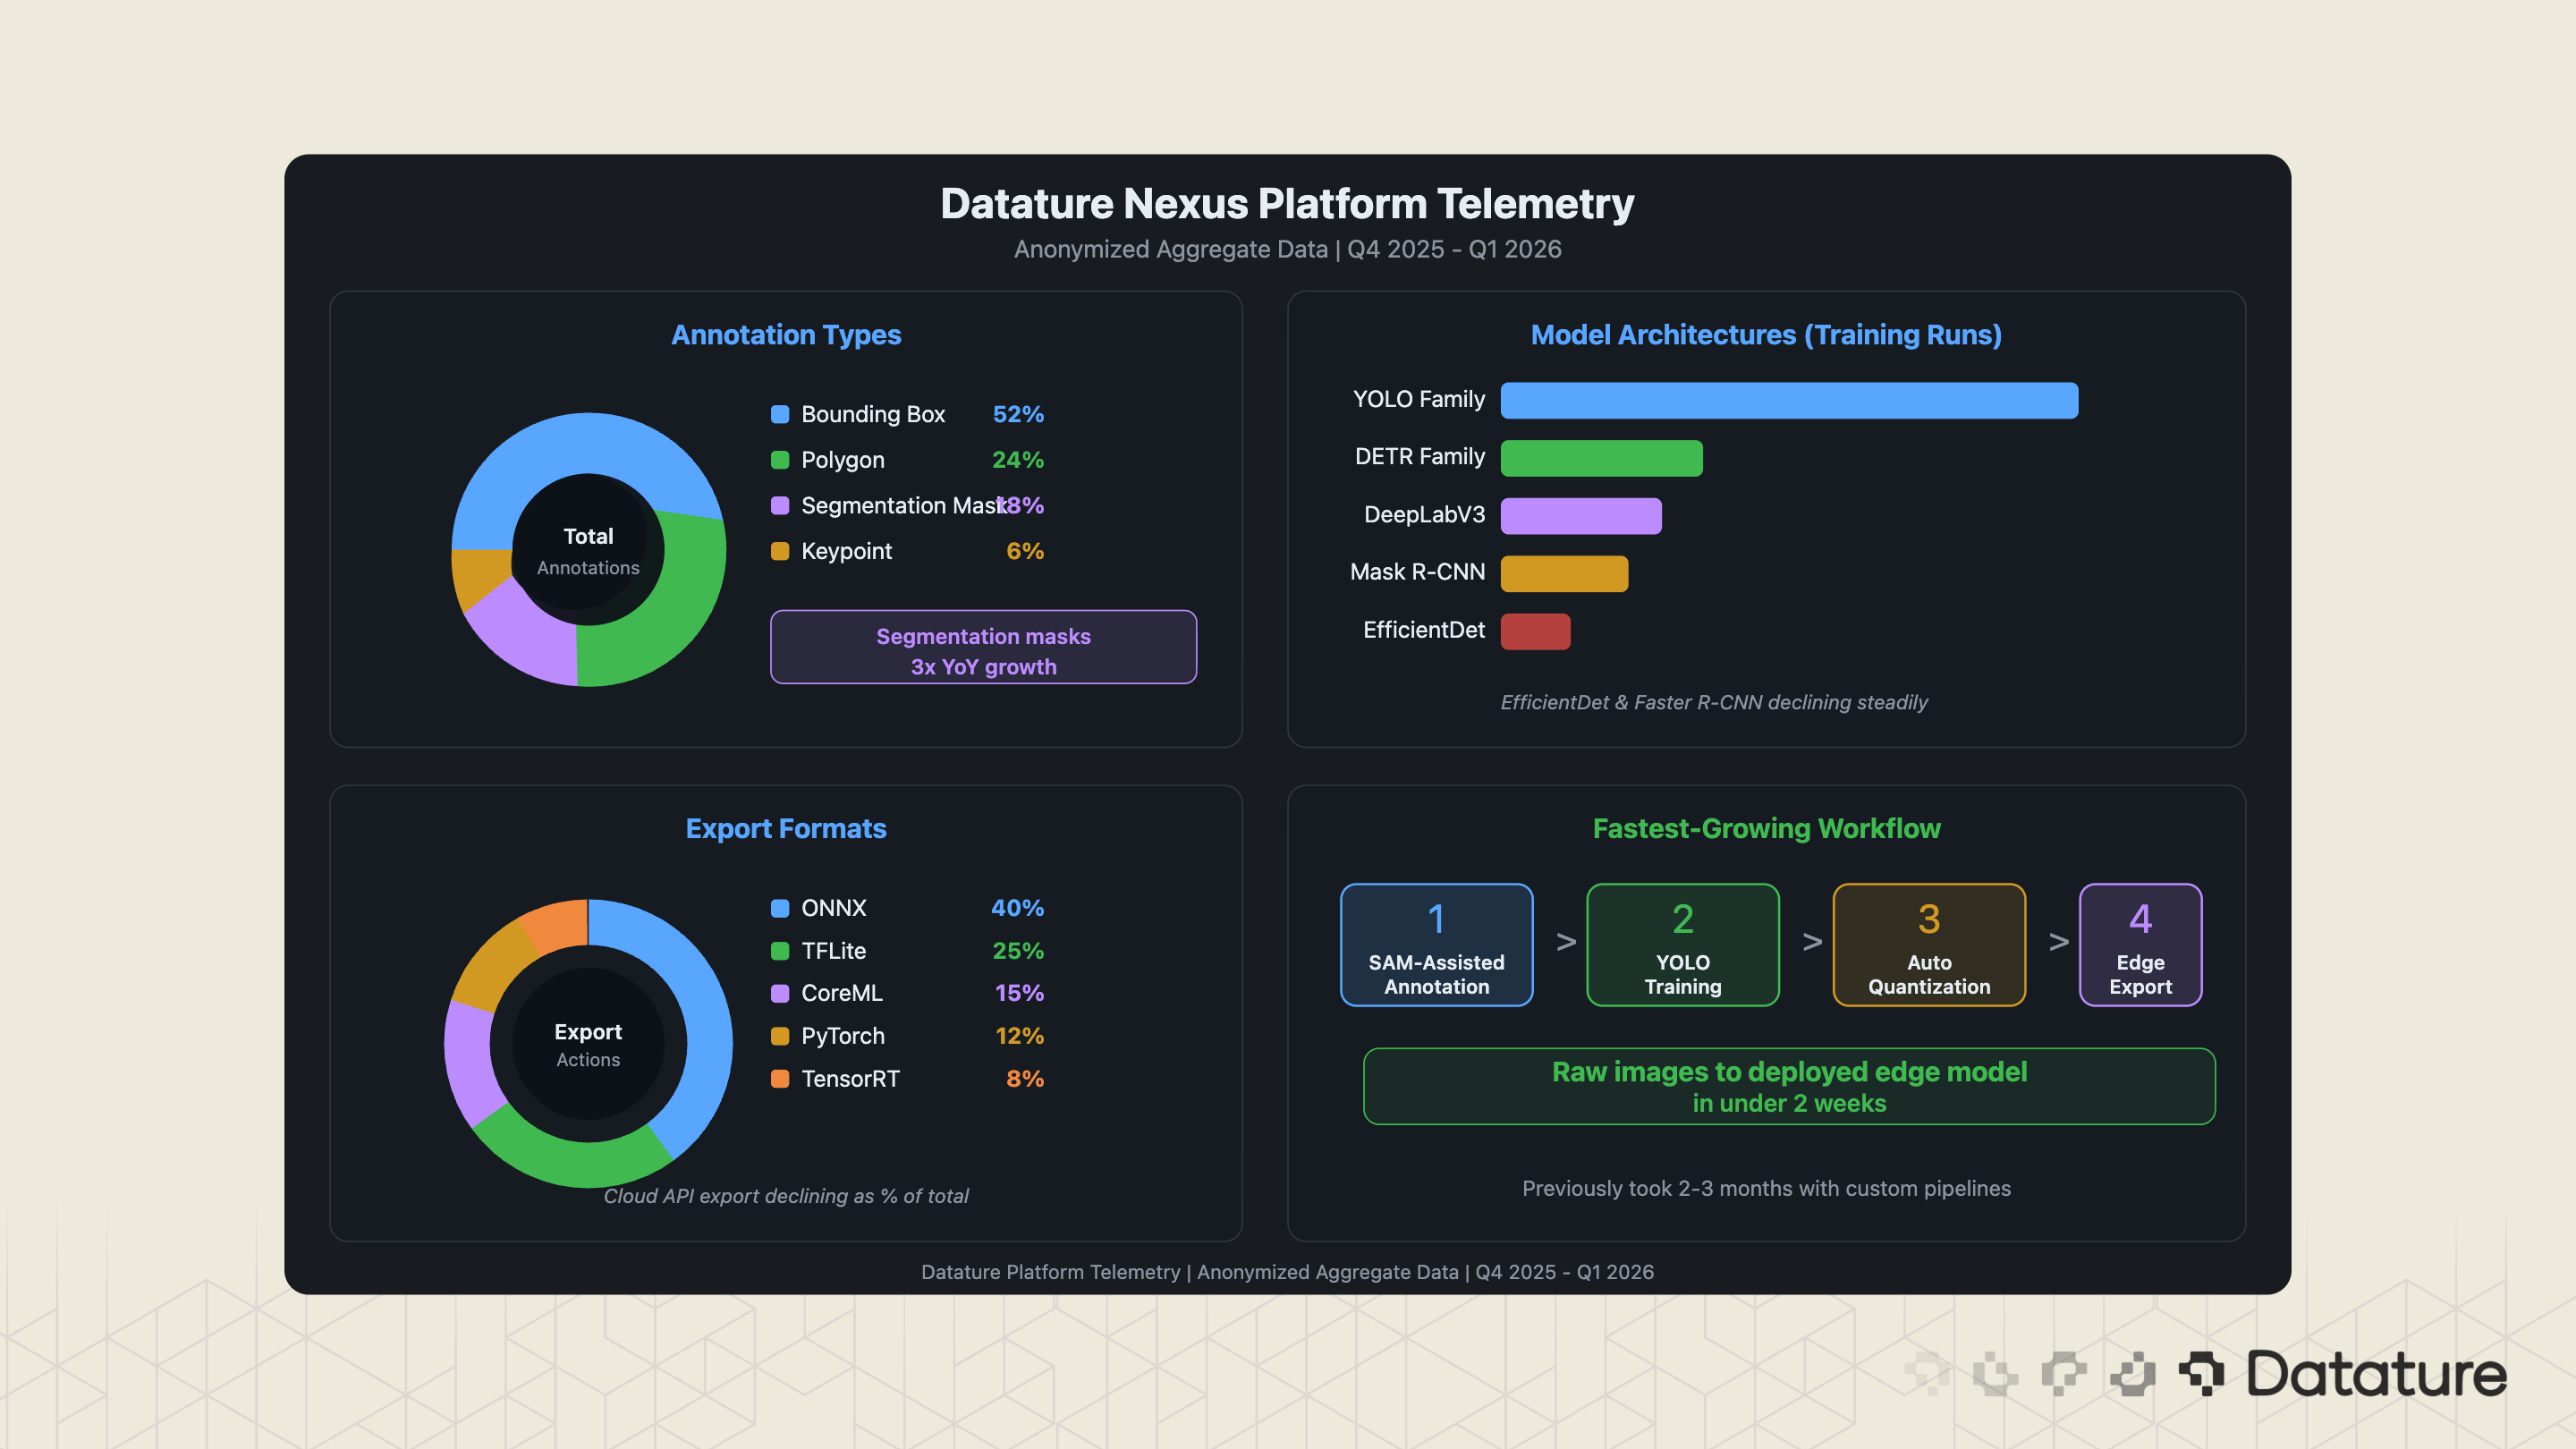
Datature processes millions of annotations and model training runs through the Nexus platform. While we cannot share customer-specific data, aggregated platform telemetry reveals patterns that align with - and sometimes diverge from - the broader market data presented above.
Annotation Patterns
Bounding box annotations still account for the majority of labeling activity on Nexus, but polygon and segmentation mask usage has grown 3x year-over-year. This tracks with the broader shift from detection-only to segmentation-capable pipelines, driven by the availability of SAM-based annotation tools that make pixel-level labeling dramatically faster. The most common annotation categories across the platform: defect types (manufacturing), anatomical structures (medical imaging), product SKUs (retail), and infrastructure damage types (inspection).
Model Architecture Choices
YOLO-family architectures remain the most-selected model type on Nexus for detection tasks, representing the majority of training runs. EfficientDet and Faster R-CNN usage has declined steadily as YOLO and DETR-based architectures have improved. For segmentation, DeepLabV3 and Mask R-CNN remain popular, though SAM-based annotation followed by lightweight segmentation heads is the fastest-growing pattern.
Deployment Targets
Export to ONNX format is the most common deployment action on Nexus, followed by TFLite (for mobile and edge) and CoreML (for Apple devices). This is consistent with the hybrid architecture pattern described above: ONNX serves as the universal intermediate format for optimization tools (TensorRT, OpenVINO), while TFLite and CoreML serve specific edge targets. Direct cloud API deployment is declining as a percentage of total exports.
Our 2026-2027 Outlook
Three developments will shape enterprise computer vision adoption over the next 12-18 months.
1. VLM-Native Inspection Pipelines
The current pattern of using YOLO for detection and VLMs for edge-case reasoning will begin to consolidate. Expect to see VLMs capable of real-time visual inspection at production speeds by late 2026, particularly for applications where the defect taxonomy is open-ended (novel defect types that cannot be pre-enumerated in an annotation schema). This does not eliminate YOLO-based pipelines - those will remain dominant for high-speed, well-defined tasks - but it expands the scope of what can be automated.
2. Regulation-Driven Data Governance
The EU AI Act, which classifies many industrial CV systems as "high-risk," is forcing enterprises to build annotation provenance, model lineage tracking, and bias auditing into their CV pipelines. Annex III high-risk AI system requirements become enforceable on August 2, 2026, with rules for high-risk AI embedded in regulated products following on August 2, 2027. This is shifting enterprise buying criteria: platforms that connect annotation to training to deployment with an auditable trail will win regulated verticals. ISO 42001 (AI management systems) certification is becoming a procurement requirement for healthcare and automotive.
3. On-Device Foundation Models
The trend toward edge deployment will accelerate as foundation model distillation techniques improve. By mid-2027, expect sub-100M-parameter foundation models that run on-device with performance comparable to what 1B+ parameter cloud models delivered in 2024. This collapses the cloud-edge gap further and makes offline, privacy-preserving CV practical for enterprises in regulated industries.
Our Developer Roadmap
We will be focusing on the development of our new platform, Datature Vi, that enables teams to build and ship Vision-Language Models. If you want to learn more about our platform → Watch The Introduction Video Here
.png)
.png)