.jpeg)
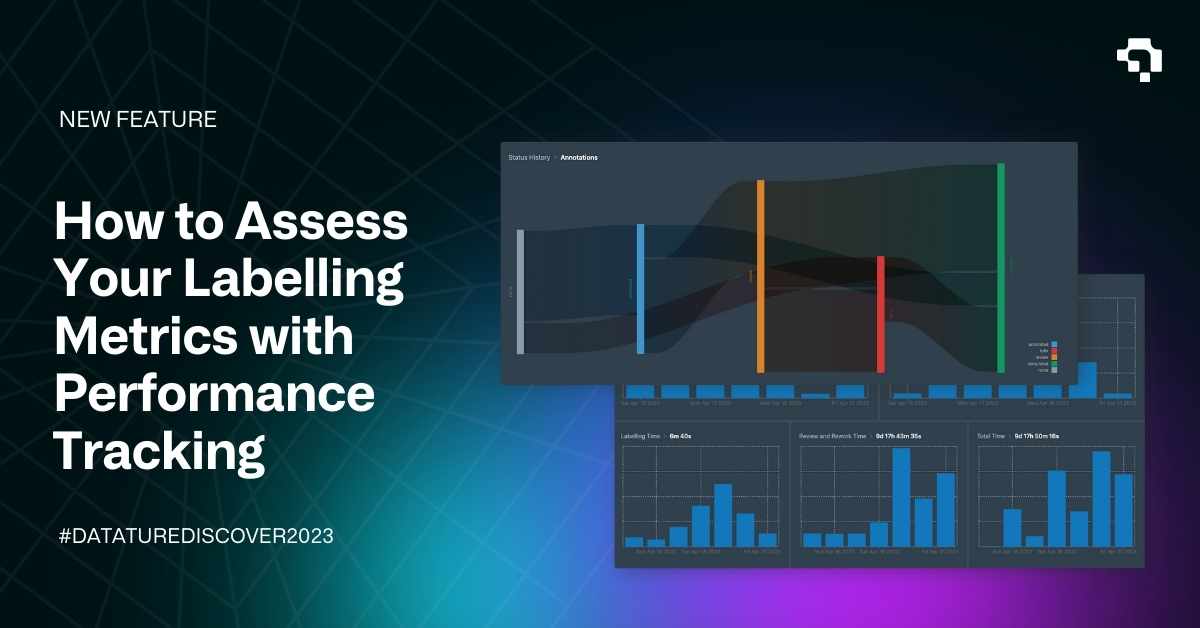

What is Performance Tracking?
Performance Tracking for labelling pipelines is the active process of recording and evaluating the accuracy and consistency of annotations made by human annotators. It involves tagging annotation tasks with quantitative metrics that project leads can utilize to monitor progress and performance.
Why is Performance Tracking Important?
Data quality is crucial for any machine learning task. It impacts how the model learns patterns and features over time. Any discrepancies in data annotations can adversely affect the performance of the model, leading to inaccurate or inconsistent results. Therefore, it is essential to ensure high-quality data annotations to achieve optimal performance of the model.
Data quality can be improved through a variety of techniques, including:
- Developing clear and concise annotation guidelines: Clear and concise annotation guidelines can help ensure that annotators understand the task and produce consistent and accurate annotations.
- Conducting regular quality checks: Regular quality checks can help identify errors and inconsistencies in the data annotations, allowing for timely corrections and improvements.
- Using multiple annotators: Using multiple annotators for the same task can help identify discrepancies and ensure that the annotations are consistent and accurate.
- Providing training and feedback to annotators: Providing training and feedback to annotators can help improve their skills and knowledge, leading to more accurate and consistent annotations over time.
Performance Tracking supports the usage of these techniques by providing quantitative metrics to grade annotators’ performance across a variety of assessments, such as efficiency and quality.
How Can You Effectively Utilize Performance Tracking in Your Nexus Project?
The Performance Tracker page can be found in the Automation section in your project. If you have made any annotations in your project, the Performance tab will reveal a dashboard containing various graphs and quantitative metrics. The metrics are saved and collected by the day, and the dashboard provides filters such as the ability to restrict the time range to the past 7 days, 30 days, 3 months, 6 months, and 12 months, as well as the ability to look at the annotation workflow for specific collaborators in the Nexus project.
%2520(1).png)
The most prominent graph is a Sankey chart that tracks the annotation progress of the whole project. Assets are aggregated based on their annotation status and the current stage of the annotation workflow. It consists of five main categories:
- None - shows the number of assets that are yet to be annotated.
- Annotated - shows the number of assets that have been annotated and submitted to the next stage.
- Review - shows the number of annotated assets that are being reviewed. This includes assets that are in the consensus stage.
- To Fix - shows the number of annotated assets that have been rejected during review and are sent for re-annotation.
- Completed - shows the number of annotated assets that are ready to be used for training.
%2520(1).png)
There are also five bar graphs that track various metrics over time. The main metrics that are covered daily are as follows:
- The number of annotations or labels annotated
- The number of reviews completed for annotated assets
- The total amount of time used for labelling
- The total amount of time used to review and rework labels
These charts will be automatically updated daily to allow you track the progress of the annotations at their various stages, and how they vary day by day. Through tracking these metrics, you can see whether you are labelling at the pace you expect, which stages take the most time, and how efficiently your individual labellers are annotating. This provides teams with quantitative metrics to determine what the main blockers in the annotation pipeline are, and help to guide and substantiate specific actionable improvements for the pipeline.
Our Developer’s Roadmap
Performance Tracking is one of the tools that we introduced to empower teams to collaborate seamlessly and effectively using our new Annotation Workflow. We have roadmaps in place to introduce other metrics that will further improve the collaborative annotation experience, such as Efficiency and Quality to assess the annotation precision for each labeller.
Want to Get Started?
If you have questions, feel free to join our Community Slack to post your questions or contact us about how active learning fits in with your usage.
For more detailed information about the Performance Tracking functionality, customization options, or answers to any common questions you might have, read more about the process on our Developer Portal.
.png)
.png)